Group Abstract Group Abstract

Message Boards Message Boards

0
|
2.8K Views
|
1 Reply
|
0 Total Likes
View groups...
Share
Share this post:

How to add label to a list of plots ?

Posted 3 years ago

Hello, I am trying to lable a list of plots. Code is given below

ClearAll["Global`*"];
Kn = {0, 0.025, 0.05, 0.1};
Subscript[\[Sigma], v] = 0.85;
Subscript[\[Alpha], v] = (2 - Subscript[\[Sigma], v])/
  Subscript[\[Sigma], v];
\[Alpha] = Subscript[\[Alpha], v] Kn;
u[r_, \[Alpha]_] := (\[Sigma] (BesselI[0, \[Sigma]] - 
     BesselI[0, 
      r \[Sigma]] + \[Alpha] \[Sigma] BesselI[
       1, \[Sigma]]))/(\[Sigma] BesselI[
     0, \[Sigma]] + (-2 + \[Alpha] \[Sigma]^2) BesselI[1, \[Sigma]]);
u1[r_] := (BesselI[0, \[Sigma]] - BesselI[0, r \[Sigma]])/
  BesselI[2, \[Sigma]];
data = Table[{r, u1[r]}, {r, 0, 1, 0.05}];

Table[
 Show[
  ListPlot[data,
   PlotMarkers -> {"\[EmptySquare]", 24},
   PlotLabel -> Style["(a)", 24, Black],
   AxesOrigin -> {0, 0},
   PlotRange -> {{0, Automatic}, {0, Automatic}},
   LabelStyle -> {FontFamily -> "Times New Roman", 24, Bold},
   PlotLegends -> Placed[{Style["\!\(\*
StyleBox[\"Kn\",\nFontSlant->\"Italic\"]\)=0 (Sharma et al.[])", \
{Bold, 20}]}, {Left, Bottom}],
   PlotStyle -> {Black, Thick}
   ],
  Plot[
   {u[r, \[Alpha][[1]]], u[r, \[Alpha][[2]]], u[r, \[Alpha][[3]]], 
    u[r, \[Alpha][[4]]]}, {r, 0, 1},

   PlotRange -> {{0, Automatic}, {0, Automatic}},
   AxesOrigin -> {0, 0},
   LabelStyle -> {FontFamily -> "Times New Roman", 24, Bold},
   PlotLegends -> Placed[{Style["\!\(\*
StyleBox[\"Kn\",\nFontSlant->\"Italic\"]\)=0", {Bold, 20}], 
      Style["\!\(\*
StyleBox[\"Kn\",\nFontSlant->\"Italic\"]\)=0.025", 20], Style["\!\(\*
StyleBox[\"Kn\",\nFontSlant->\"Italic\"]\)=0.05", 20], Style["\!\(\*
StyleBox[\"Kn\",\nFontSlant->\"Italic\"]\)=0.1", 20]}, {Left, Bottom}],
   PlotStyle -> {{Black, Thick}, {Blue, Thick}, {Red, Thick}, {Green, 
      Thick}, {Orange, Thick}}
   ],
  ImageSize -> Large,
  AxesStyle -> {Black, Black},
  AxesLabel -> {r, "\!\(\*OverscriptBox[\(u\), \(^\)]\)"}

  ], {\[Sigma], {1, 5, 20, 40}}
 ]

enter image description here

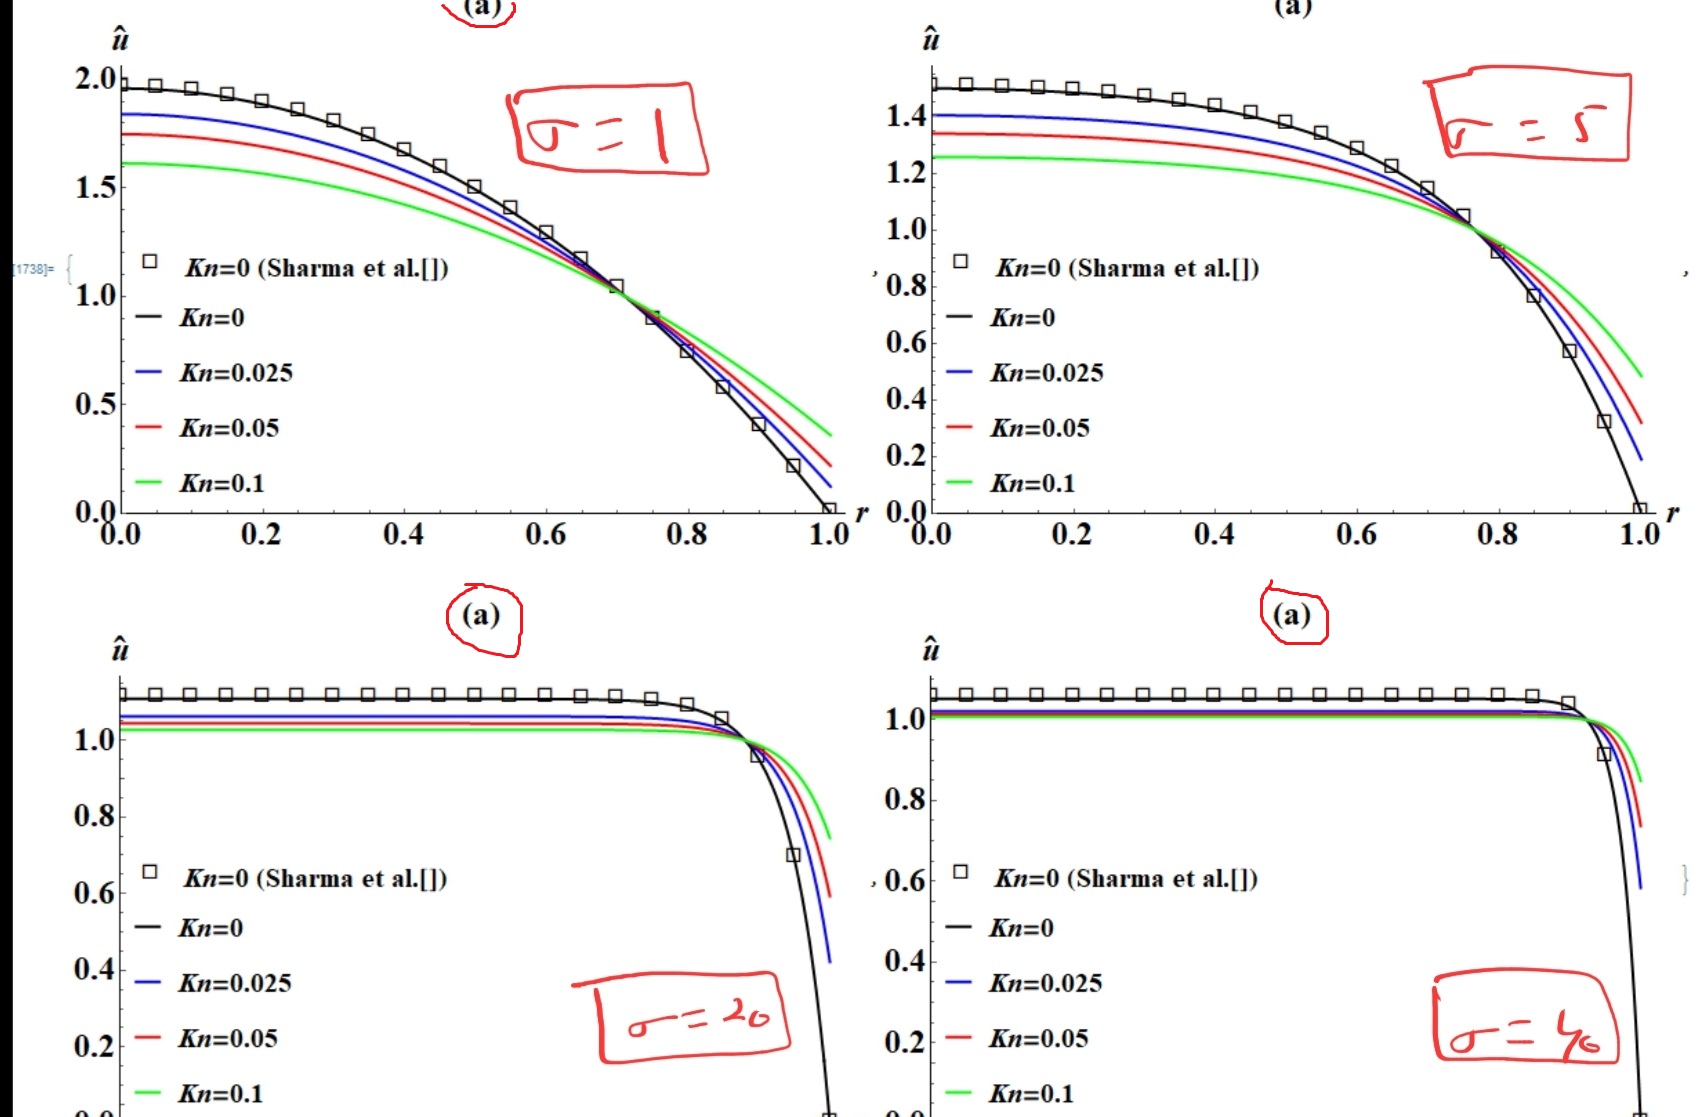
I want to add the labels like (a),(b),(c),(d) on each plot and PlotLegends with changing sigma value as roughly depicted in figures.

POSTED BY: KRISHAN SHARMA
Posted 3 years ago

You can use Legended to add your legend. Wrap it around the Show expression.

To get the (a),(b),(c),(d) labels, I think your best bet is to add them after you've built the table. If it's inside the Show (and in particular, inside the ListPlot in this case), then you'd need something that varies for each iteration of the Table. The only such thing you have is sigma, and it would be kind of weird to create a formula that mapped those arbitrary sigma values to the correct strings. It also wouldn't be very maintainable. So, I'd create a separate List that contained your labels. You can still construct it somewhat dynamically. Let's say you plan on having more plots, so you want the size of the label list to match the size of the plot table. You could take the first N letters of Alphabet[] where N is the Length of your table. Then you'd need to thread or transpose your table with your labels.

Also, your table is 1D (as produced by the code) but your illustration is 2D. If you want 2D, you can partition/reshape your table and apply Grid.

Demonstrating with a simpler core element:

items =
  Table[
   Legended[Graphics[{color, Circle[]}], 
    Style[ToString@color, 14, Italic, FontFamily -> "Verdana"]],
   {color, {Red, Blue, Green, Orange}}];
labels = 
  StringInsert["()", #, 2] & /@ Take[Alphabet[], Length@items];
Grid[Partition[Thread[Labeled[items, labels, Top]], 2], 
 Dividers -> All]
POSTED BY: Eric Rimbey
Reply to this discussion
Community posts can be styled and formatted using the Markdown syntax.
Reply Preview
Attachments
Remove
or Discard