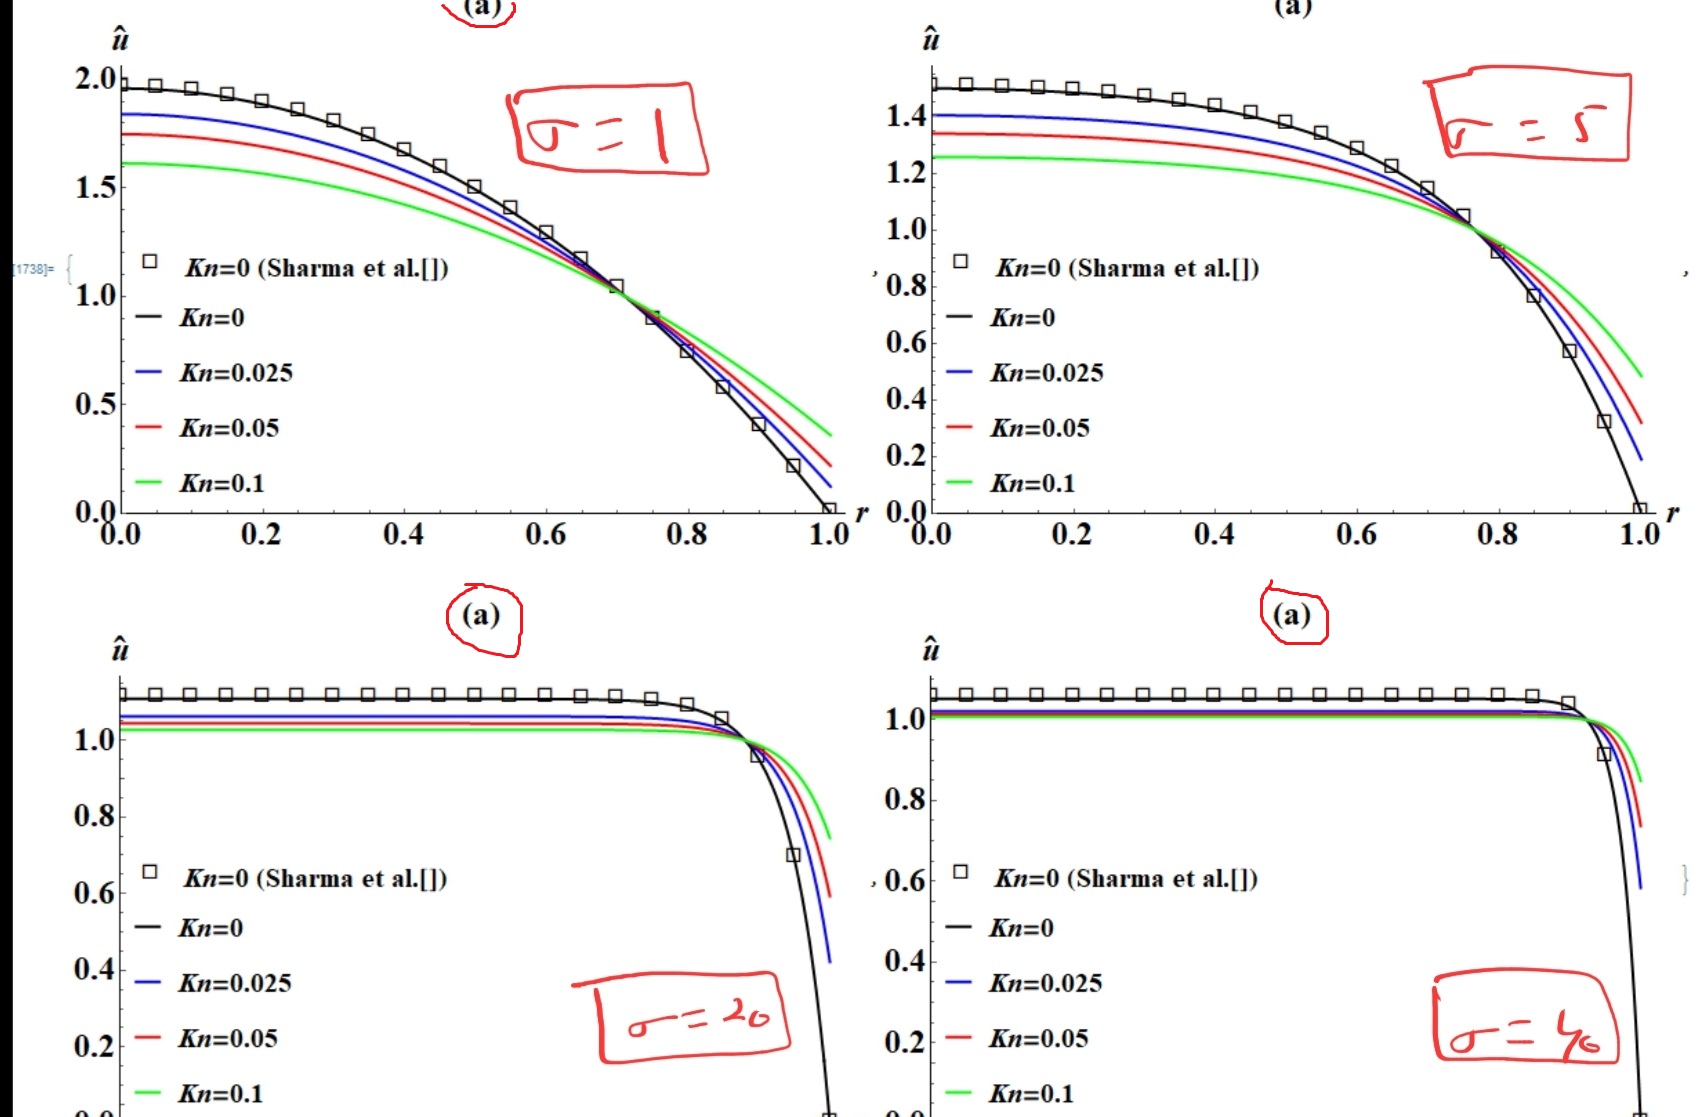
Hello, I am trying to lable a list of plots. Code is given below
ClearAll["Global`*"];
Kn = {0, 0.025, 0.05, 0.1};
Subscript[\[Sigma], v] = 0.85;
Subscript[\[Alpha], v] = (2 - Subscript[\[Sigma], v])/
  Subscript[\[Sigma], v];
\[Alpha] = Subscript[\[Alpha], v] Kn;
u[r_, \[Alpha]_] := (\[Sigma] (BesselI[0, \[Sigma]] -
     BesselI[0,
      r \[Sigma]] + \[Alpha] \[Sigma] BesselI[
       1, \[Sigma]]))/(\[Sigma] BesselI[
     0, \[Sigma]] + (-2 + \[Alpha] \[Sigma]^2) BesselI[1, \[Sigma]]);
u1[r_] := (BesselI[0, \[Sigma]] - BesselI[0, r \[Sigma]])/
  BesselI[2, \[Sigma]];
data = Table[{r, u1[r]}, {r, 0, 1, 0.05}];

Table[
 Show[
  ListPlot[data,
   PlotMarkers -> {"\[EmptySquare]", 24},
   PlotLabel -> Style["(a)", 24, Black],
   AxesOrigin -> {0, 0},
   PlotRange -> {{0, Automatic}, {0, Automatic}},
   LabelStyle -> {FontFamily -> "Times New Roman", 24, Bold},
   PlotLegends -> Placed[{Style["\!\(\*
StyleBox[\"Kn\",\nFontSlant->\"Italic\"]\)=0 (Sharma et al.[])", \
{Bold, 20}]}, {Left, Bottom}],
   PlotStyle -> {Black, Thick}
   ],
  Plot[
   {u[r, \[Alpha][[1]]], u[r, \[Alpha][[2]]], u[r, \[Alpha][[3]]],
    u[r, \[Alpha][[4]]]}, {r, 0, 1},

   PlotRange -> {{0, Automatic}, {0, Automatic}},
   AxesOrigin -> {0, 0},
   LabelStyle -> {FontFamily -> "Times New Roman", 24, Bold},
   PlotLegends -> Placed[{Style["\!\(\*
StyleBox[\"Kn\",\nFontSlant->\"Italic\"]\)=0", {Bold, 20}],
      Style["\!\(\*
StyleBox[\"Kn\",\nFontSlant->\"Italic\"]\)=0.025", 20], Style["\!\(\*
StyleBox[\"Kn\",\nFontSlant->\"Italic\"]\)=0.05", 20], Style["\!\(\*
StyleBox[\"Kn\",\nFontSlant->\"Italic\"]\)=0.1", 20]}, {Left, Bottom}],
   PlotStyle -> {{Black, Thick}, {Blue, Thick}, {Red, Thick}, {Green,
      Thick}, {Orange, Thick}}
   ],
  ImageSize -> Large,
  AxesStyle -> {Black, Black},
  AxesLabel -> {r, "\!\(\*OverscriptBox[\(u\), \(^\)]\)"}

  ], {\[Sigma], {1, 5, 20, 40}}
 ]

I want to add the labels like (a),(b),(c),(d) on each plot and PlotLegends with changing sigma value as roughly depicted in figures.