And so here it is, what we do is the singular completed reduction of the number of insertions. What if we don't want the tables to be 100% full? What if, well then we use a load factor of 0.5 rather than inserting 2^(2n) numbers. It turns out we can in fact record the number of displacements per insertion and then plot a histogram of those counts. What we can do is adjust the load factor as desired. For instance if we have n = 4 i.e. 16 buckets per table, 32 total then we insert about 16 elements so that not all buckets are occupied. Then we are ready to insert..only a fraction of the total usage, of the total capacity of buckets. Of course we can also generate a bipartite graph that shows the displacement edges and the cycle analysis that remain as before. It's sort of like Pi day, the time comes when the time goes, and the occupancy states..allow us to experiment with additional visualizations as needed, I was rolling through on a silver platter. The first time I tried this I was getting what, that every single part of the displacement graph was occupied every time, to say the least. You have to remember that the ratio of the circumference to the diameter of a circle, it's 3.141592653589793238..people were using approximations to Pi the development, the use of Pi got more accurately computed. For a while in Europe it was called Ludolf's constant, there was a chap in Europe called Ludolf..the name Pi came from a chap called Jones, maybe William Jones in England? But it was really adopted by Leonard Euler in the 1700s, but that led to..well, Euler introduced several pieces of notation in Mathematics. Euler was a prolific mathematician, I have a collection of his works, it's a shelf. I think it's all in Latin. The formerly look completely modern and the text is in Latin but he had a notation of calculus pretty much in its modern form. And in its modern form it is. And that's why to this day it sort of, does not look like something a cuckoo bird would make, at least not in its modern representation. I would reckon that in this context, "cuckoo" is really about this hashing technique that is "inspired by" the behavior of the cuckoo bird. Cuckoo birds as you know are known, for laying their eggs in the nests of other bird species.
n = 4;
maxTries = 10;
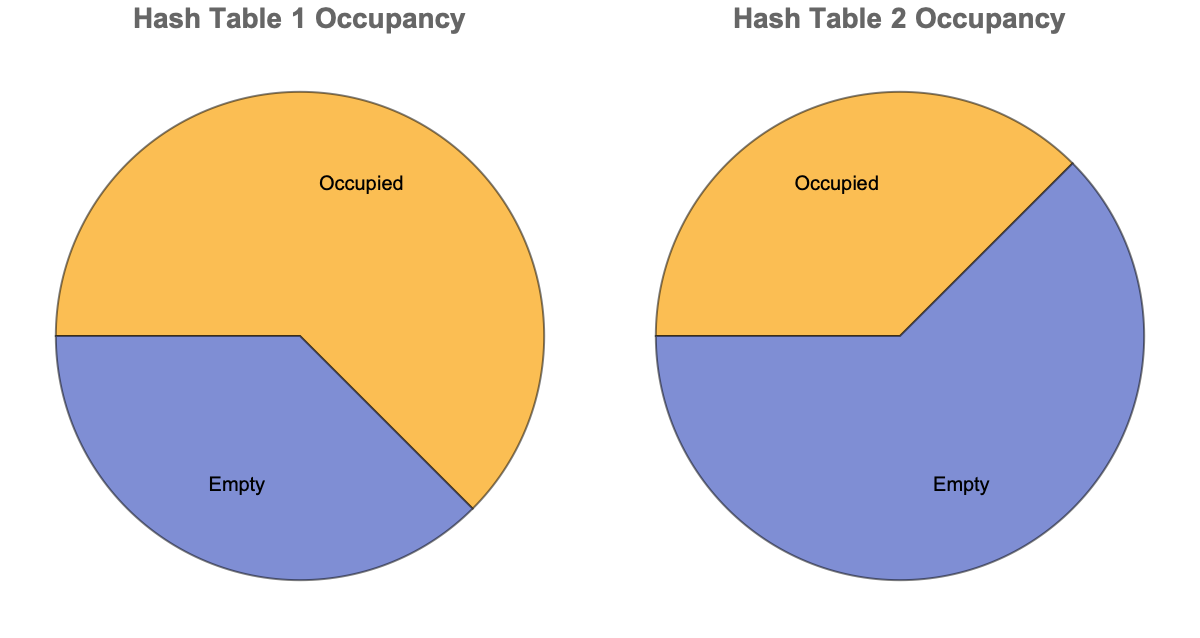
loadFactor = 0.5;
numElements = Floor[loadFactor*2^(n + 1)];
list1 = Table[Null, {2^n}];
list2 = Table[Null, {2^n}];
hash1[x_] := Mod[Hash[x, {"BLAKE2b", 8}], 2^n] + 1;
hash2[x_] := Mod[Hash[x, {"BLAKE2s", 8}], 2^n] + 1;
displacements = 0;
failedInsertions = 0;
displacementCounts = {};
insert[x_] :=
Module[{current = x, pos, tmp, tries = 0, disps = 0},
While[tries < maxTries, pos = hash1[current];
If[list1[[pos]] === Null, list1[[pos]] = current;
AppendTo[displacementCounts, disps];
Return[True]];
tmp = list1[[pos]];
list1[[pos]] = current;
current = tmp;
disps++;
pos = hash2[current];
If[list2[[pos]] === Null, list2[[pos]] = current;
AppendTo[displacementCounts, disps];
Return[True]];
tmp = list2[[pos]];
list2[[pos]] = current;
current = tmp;
disps++;
tries++;
displacements += disps;];
failedInsertions++;
AppendTo[displacementCounts, disps];
Return[False];];
numbers1 = RandomSample[Range[0, 100000], numElements];
insertResults = insert /@ numbers1;
occupied1 = Map[If[# === Null, 0, 1] &, list1];
occupied2 = Map[If[# === Null, 0, 1] &, list2];
occupancyPie1 =
PieChart[{Count[occupied1, 1], Count[occupied1, 0]},
ChartLabels -> {"Occupied", "Empty"},
PlotLabel -> Style["Hash Table 1 Occupancy", Bold, 14],
ImageSize -> 300];
occupancyPie2 =
PieChart[{Count[occupied2, 1], Count[occupied2, 0]},
ChartLabels -> {"Occupied", "Empty"},
PlotLabel -> Style["Hash Table 2 Occupancy", Bold, 14],
ImageSize -> 300];
Row[{occupancyPie1, occupancyPie2}]
displacementHist =
Histogram[displacementCounts,
PlotLabel -> Style["Displacement per Insertion", Bold, 14],
AxesLabel -> {"Displacements", "Frequency"}, ImageSize -> 400];
displacementHist
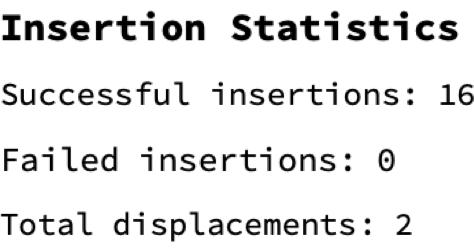
Print[Style["Insertion Statistics", Bold, 14]];
Print["Successful insertions: ", Count[insertResults, True]];
Print["Failed insertions: ", failedInsertions];
Print["Total displacements: ", displacements];
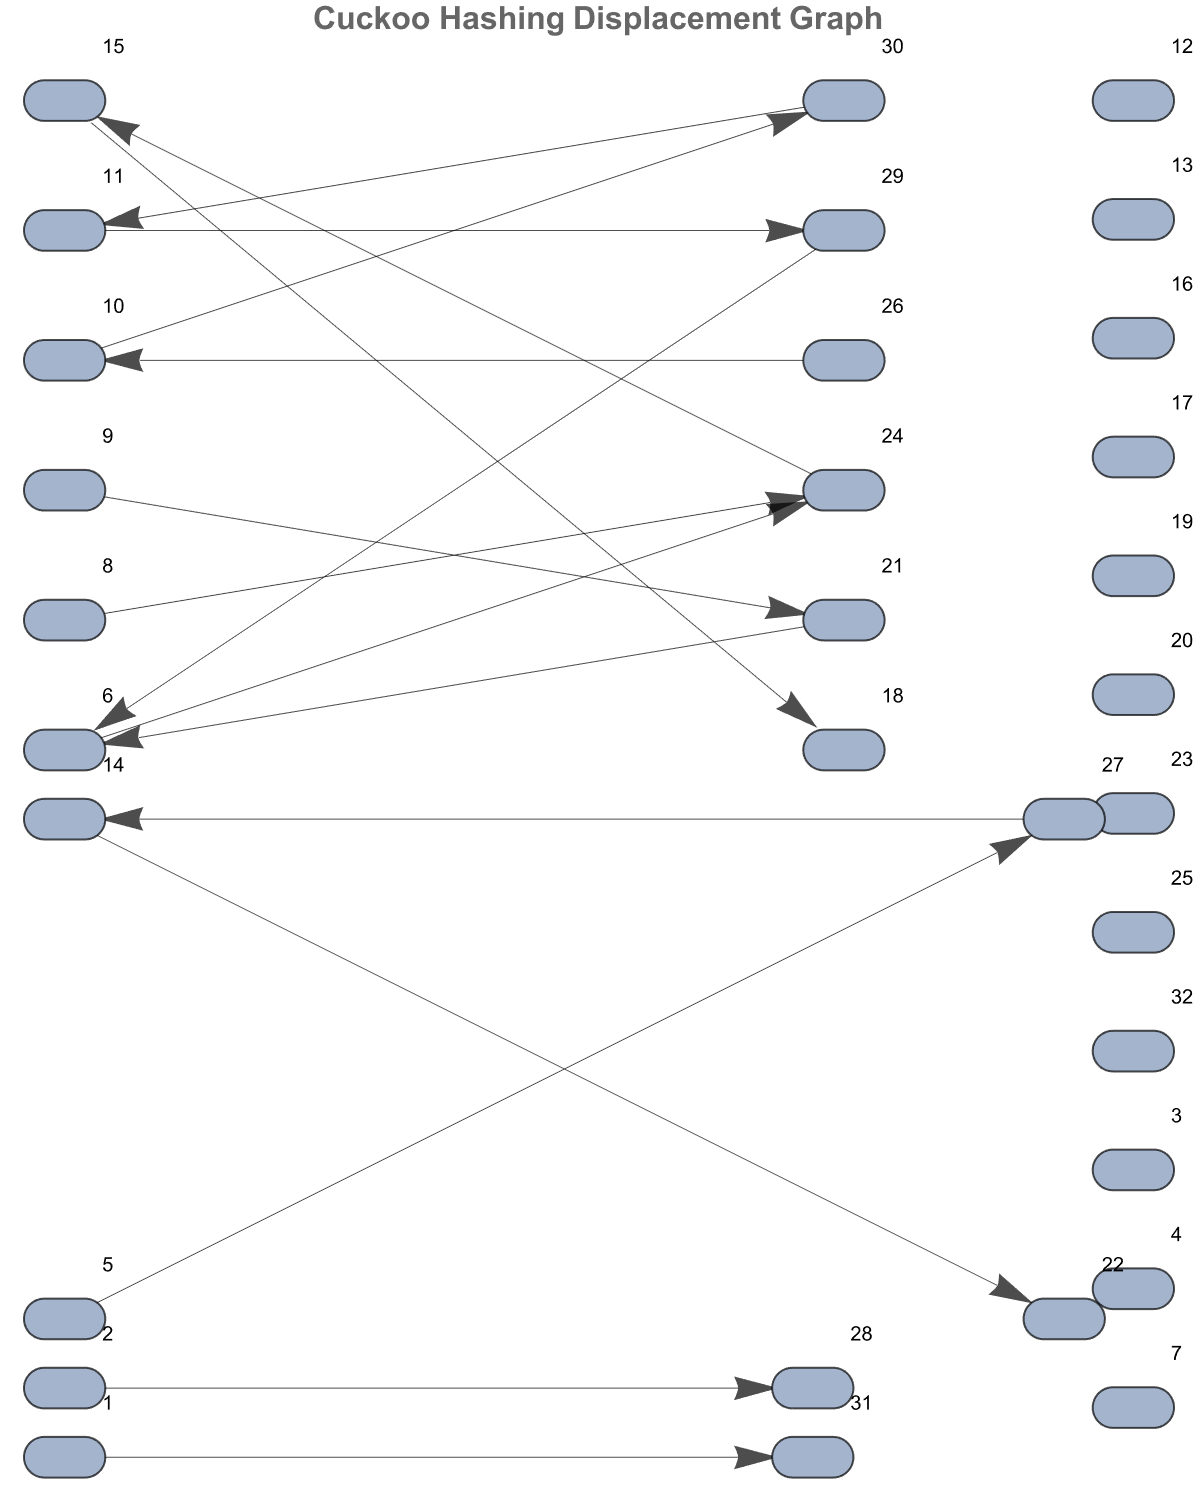
leftNodes = Range[2^n];
rightNodes = 2^n + Range[2^n];
edges = Join[
Flatten[Table[
If[list1[[i]] =!= Null, {i -> 2^n + hash2[list1[[i]]]},
Nothing], {i, 1, 2^n}]],
Flatten[Table[
If[list2[[i]] =!= Null, {2^n + i -> hash1[list2[[i]]]},
Nothing], {i, 1, 2^n}]]];
graph = Graph[Join[leftNodes, rightNodes], DirectedEdge @@@ edges,
GraphLayout -> "BipartiteEmbedding", VertexLabels -> "Name",
VertexShapeFunction -> "Capsule",
EdgeStyle -> Directive[Black, Thickness[0.001]], VertexSize -> 1,
ImageSize -> 600,
PlotLabel ->
Style["Cuckoo Hashing Displacement Graph", Bold, 16]];
graph
cycles = FindCycle[graph, Infinity, All];
cycleLengths = Length /@ cycles;
If[Length[cycles] > 0,
Histogram[cycleLengths,
PlotLabel -> Style["Cycle Length Distribution", Bold, 14],
AxesLabel -> {"Cycle Length", "Frequency"}, ImageSize -> 400],
Print["No cycles found in the displacement graph"]]

Analogously, in cuckoo hashing, when a new element is inserted into the hash table and its target bucket is already occupied, the existing element is "displaced" (or "kicked out") to another location, much like a cuckoo egg displacing a host's egg. This process may continue, with elements being moved between two hash tables (or two possible positions), until every element finds a place or a rehash is needed. Euler had a different constant, usually called Gamma.
n = 3;
numbers1 = RandomSample[Range[0, 100000], 2^(2*n)];
hash1[x_] := Mod[Hash[x, {"BLAKE2b", 8}], 2^n] + 1;
hash2[x_] := Mod[Hash[x, {"BLAKE2s", 8}], 2^n] + 1;
edges = Map[
   Function[x,
    DirectedEdge["L1-" <> ToString[hash1[x]],
     "L2-" <> ToString[hash2[x]]]], numbers1];
g = Graph[edges,
   GraphLayout -> {"BipartiteEmbedding", "Rotation" -> -Pi/4},
   VertexLabels -> Placed["Name", Center], VertexSize -> 1.5,
   EdgeStyle -> Directive[Gray, Opacity[0.3]], ImageSize -> 800];
cycles = FindCycle[g, Infinity, All];
highlightedGraph =
  If[Length[cycles] > 0,
   HighlightGraph[g, cycles, GraphHighlightStyle -> {"Thick", "Red"}],
    g];
l1Buckets = ("L1-" <> ToString[#]) & /@ Range[1, 2^n];
l2Buckets = ("L2-" <> ToString[#]) & /@ Range[1, 2^n];
degreesL1 = VertexDegree[g, #] & /@ l1Buckets;
degreesL2 = VertexDegree[g, #] & /@ l2Buckets;
histogramL1 =
  Histogram[degreesL1, {1}, AxesLabel -> {"Degree", "Count"},
   ChartStyle -> LightBlue,
   PlotLabel -> Style["List1 Bucket Usage", "Subtitle"],
   ImageSize -> 300];
histogramL2 =
  Histogram[degreesL2, {1}, AxesLabel -> {"Degree", "Count"},
   ChartStyle -> LightRed,
   PlotLabel -> Style["List2 Bucket Usage", "Subtitle"],
   ImageSize -> 300];
stats = Grid[{{"Number of Elements",
     Length[numbers1]}, {"Buckets per Table",
     2^n}, {"Load Factor (elements/bucket)",
     Round[Length[numbers1]/(2*2^n), 0.01]}, {"Total Edges",
     Length[edges]}, {"Unique Edges",
     Length[DeleteDuplicates[edges]]}, {"Cycles Detected",
     If[Length[cycles] > 0, Length[cycles], "None"]}}, Frame -> All,
   Alignment -> {{Left, Right}, Automatic},
   Background -> {{None}, {{LightGray, None}}},
   Dividers -> {False, {True, True, False}}];
Grid[{{Style["Cuckoo Hashing Relationship Graph", "Title",
    TextAlignment -> Center]}, {GraphPlot[highlightedGraph]}, {Style[
    "Bucket Distribution Analysis",
    "Section"]}, {Row[{histogramL1, histogramL2},
    Spacer[20]]}, {Style["System Statistics", "Section"]}, {stats}},
 Spacings -> {1, 1.5}, Alignment -> Center, Frame -> None]
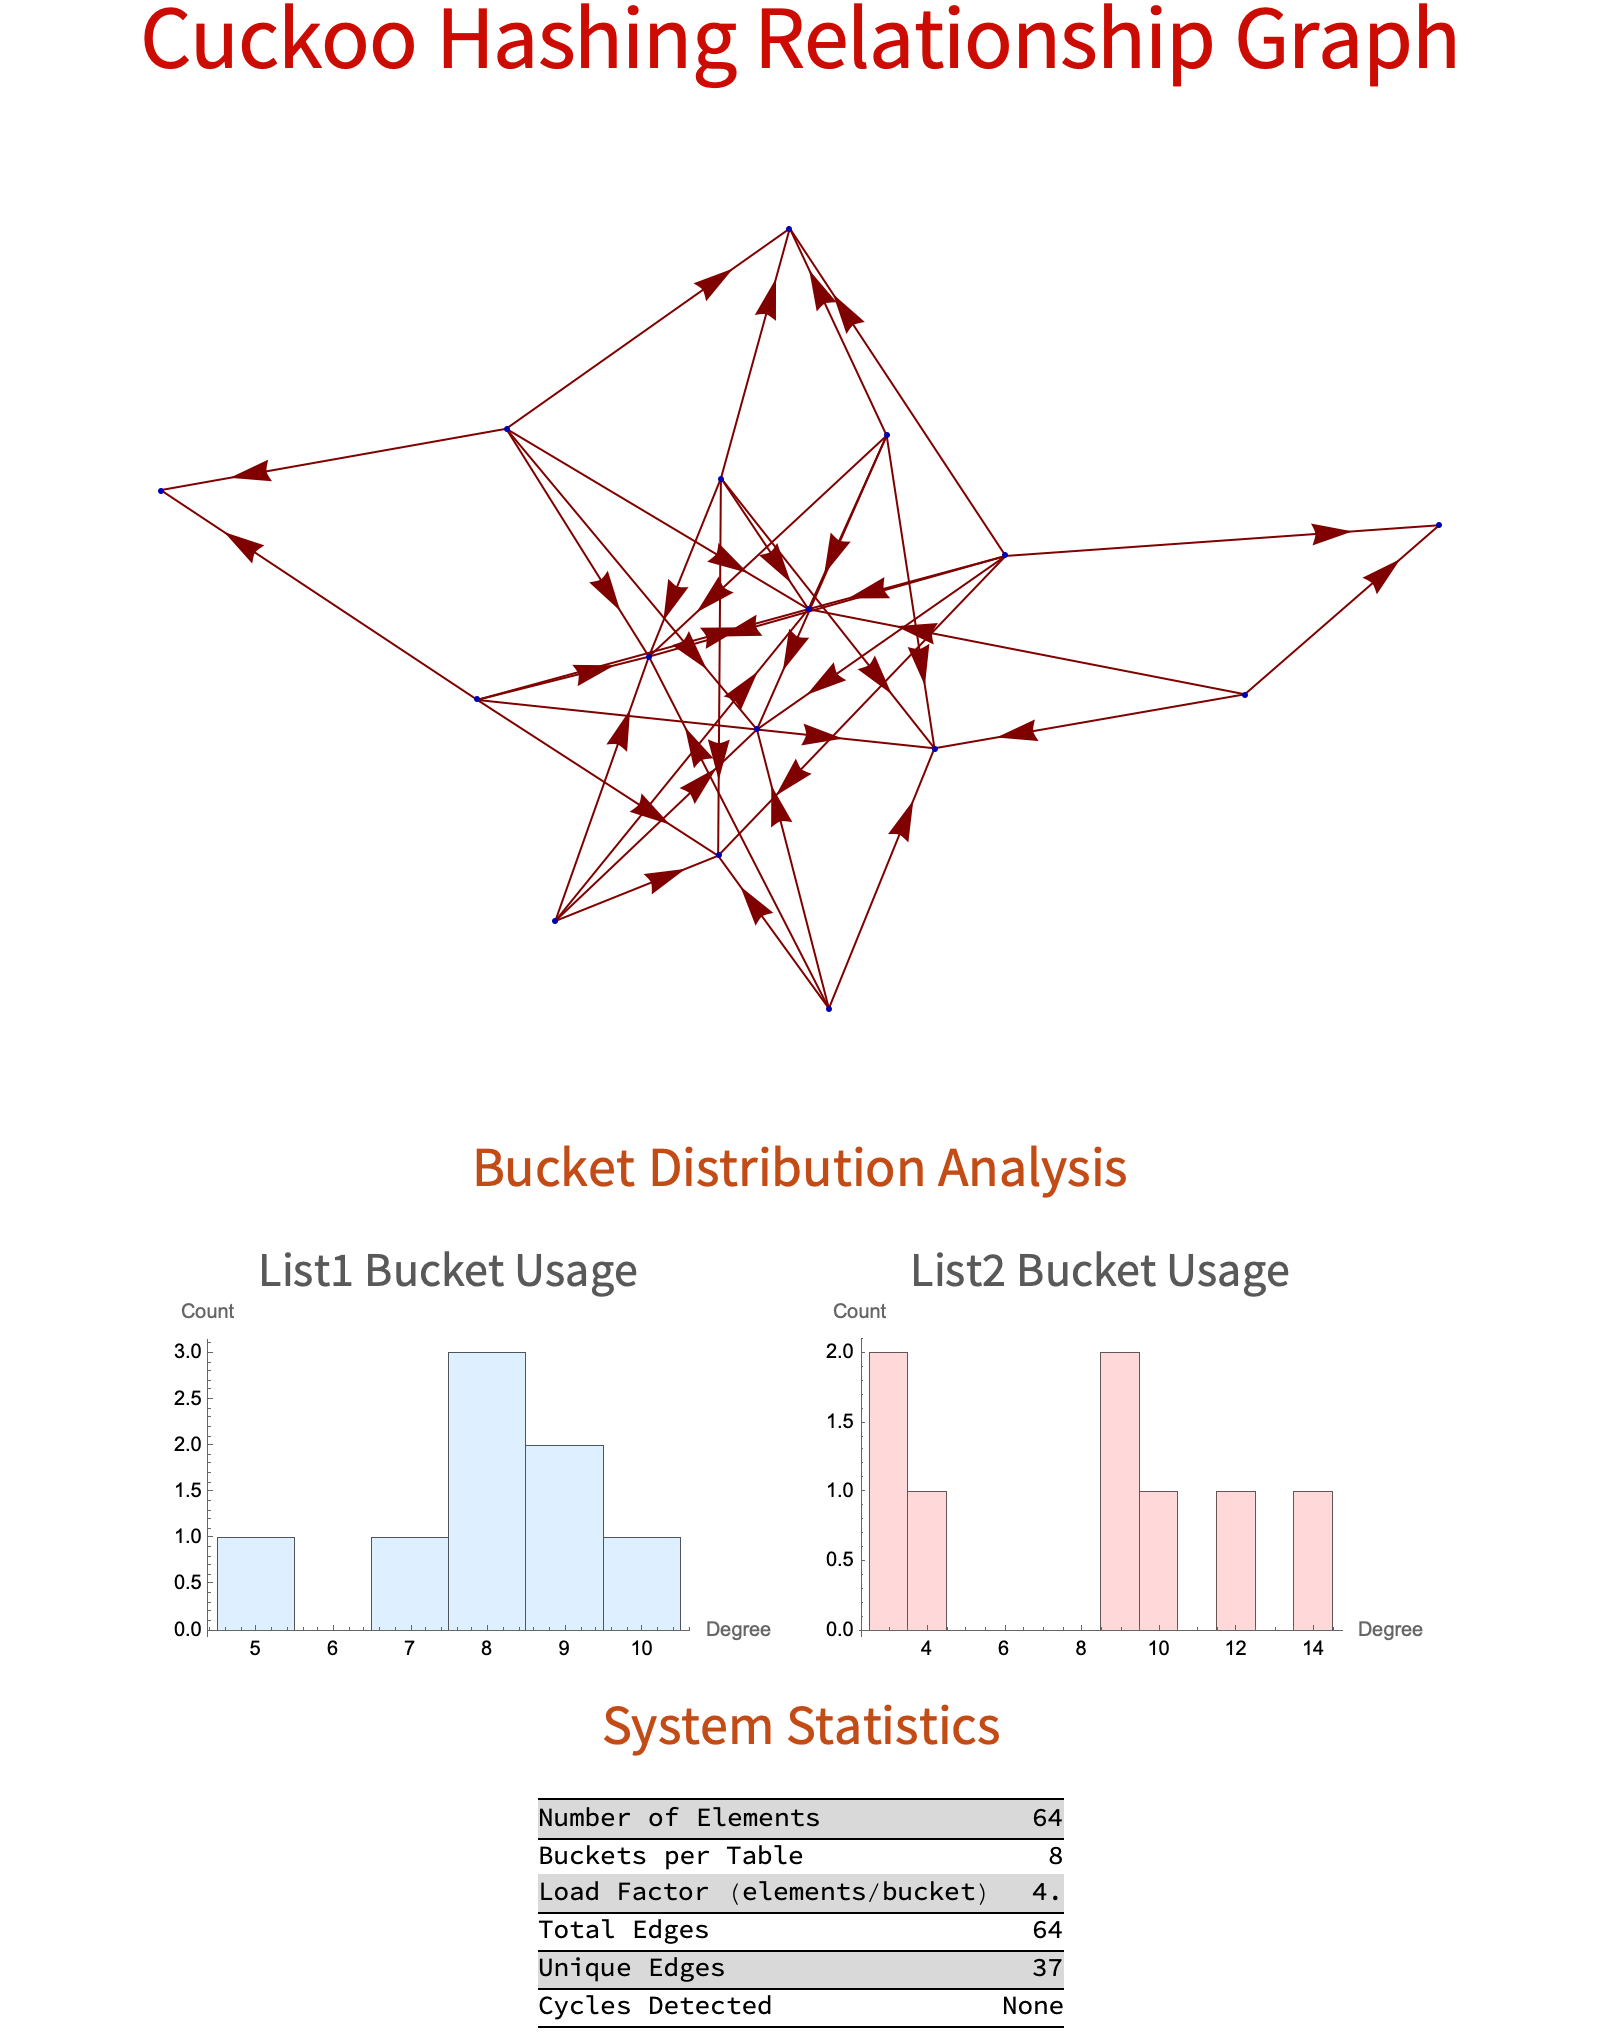
Then we ought to set the exponent so that each hash table (or list) has 2^n buckets..furthermore we know that in this case, 2^3 = 8 buckets per table which takes us to the increase in n, which increases the number of buckets (e.g., n = 4 gives 16 buckets). numbers1, being a random sample of numbers from 0 to 100,000..the sample size being 2^{2n} practically guarantees that with n = 3, that gives 2^6 = 64 numbers that is the input for hashing. Thus the Ruliad, and the Hash[x, {"BLAKE2b", 8}] and Hash[x, {"BLAKE2s", 8}] that come with it..compute an 8-bit hash of x using two different algorithms..and we get some mapping of the raw hash into a number between 1 and 2^n that is starting to look more and more appetizing as we bring the raw hash into the Mod[..., 2^n] + 1 range..i.e. 1 to 8 when n = 3. That means each input number gets mapped to a bucket just in the range 1-8 for each hash function. And so these two lists..the directed edges are created from vertices labeled L1 to L2..and thus capture the relationship between the buckets chosen by the two different hash functions for each element. That is how we construct a graph from the list of edges. And this is where the Pi comes into play, for every graph is constructed from the list of edges and every bipartite structure we visualize via the vertices in the two layers (L1 and L2)..and then we can look for cycles..a cycle is a closed loop of edges. "Rotation" -> -Pi/4 rotates the layout by -Pi/4 radians for visual effect. The thick red lines, these are the HighlightGraph cycles and we create lists of bucket names. You just have to promise to do whatever Wolfram tells you to do and that is how I got a measure of how "Loaded" each bucket is. I found the number of edges incident on each bucket vertex (i.e. how many elements hashed to that bucket). I create two histograms..one to show the distribution of bucket occupancy (degree) for list 1, and one to do the same for list 2. I bin the degrees for the histogram (number of edges per bucket) wide and wide with a bin of 1, and then we are ready to construct a grid to display key system statistics. If you take a little peep at it it's not something that we want to throw out, it's an expired catalog of the total number of elements processed, the number of buckets per table, the load factor (the average number of elements per bucket), the total number of edges in the graph, the number of unique edges (removing duplicate connections), and the number of cycles detected in the graph. Is it true that you could traverse the input space between the hash tables? Bitcoin mining? After all, we are just generating. We are generating data for the bipartite graph. We're using two hash functions to simulate cuckoo hashing..create a bipartite graph connecting two sets of hash table buckets, highlight cycles in that graph, and provide detailed statistics on bucket occupancy and edge distribution and you WILL..close your eyes for a moment and take a, visualization component such as the histograms, graph and grid.and you will understand how evenly (or unevenly) the elements can be distributed across the hash tables and whether any cycles (which indicate potential problems in cuckoo hashing) occur.
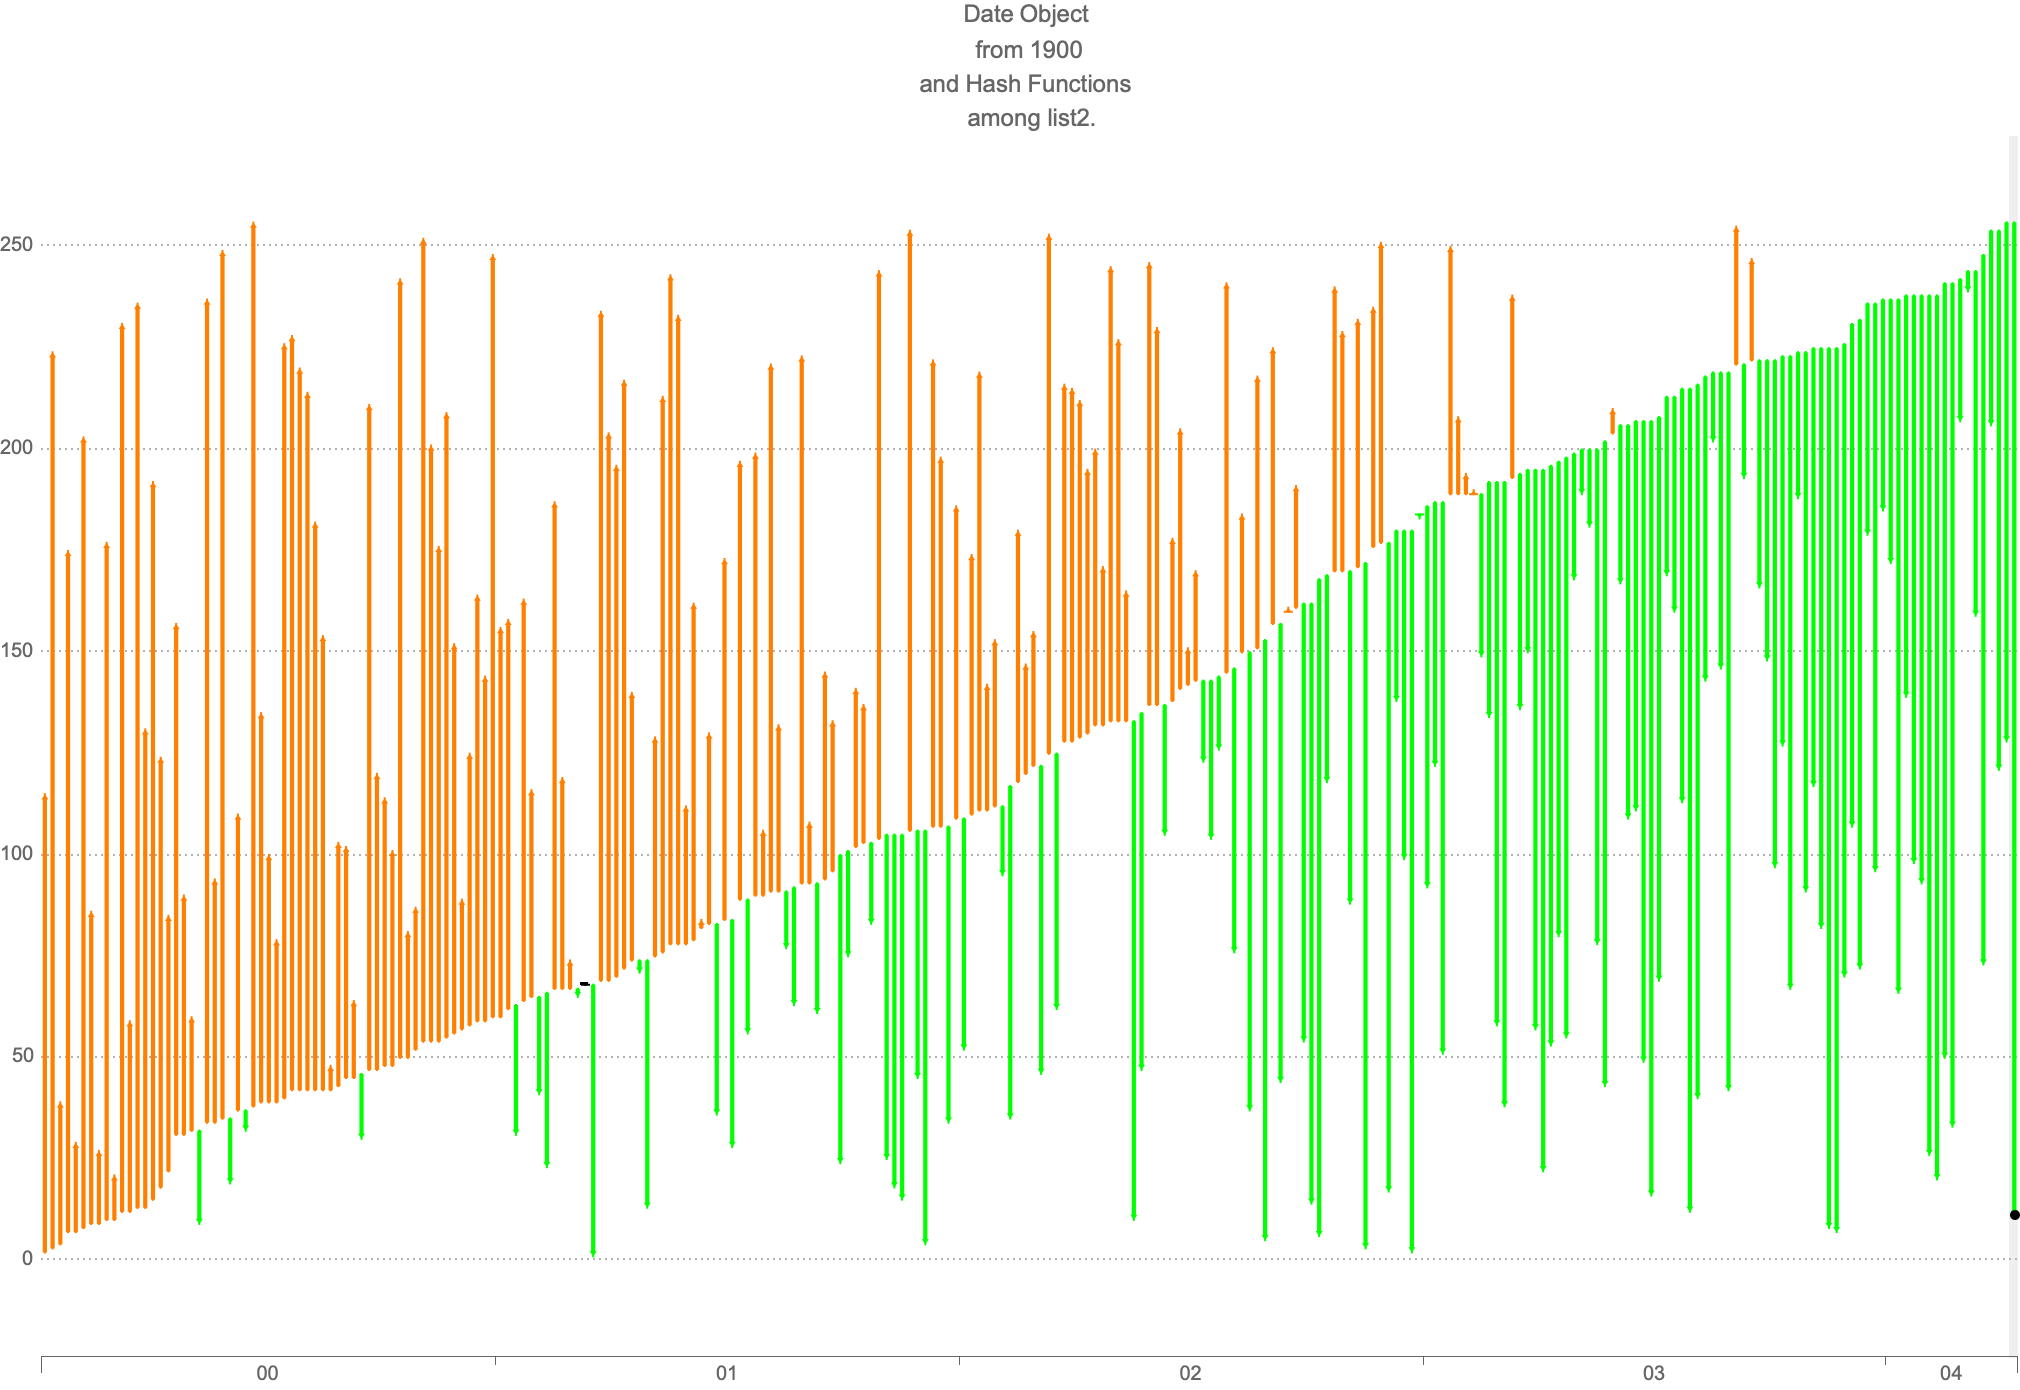
Graphics[
 CandlestickChart[
  MapIndexed[{
     DateList[
      DateObject[
       First[#2]]], #1
     } &, Flatten[
    Drop[
     Sort[
      Map[({#[[1]],
          {#[[2]][[1]],
           #[[2]][[1]],
           hash1[#[[2]][[2]]],
           hash2[#[[2]][[2]]]}
          }) &, list2],
      #1[[2]][[3]] < #2[[2]][[3]] &],
     0, 1],
    1]],
  TrendStyle -> {Orange, Green, Red},
  PlotLabel -> "Date Object \n from 1900
and Hash Functions \n among list2.",
  PlotTheme -> "Business"]]
The transposition of directed edges & exponential cycles in the Ruliad, this is so useful. It's really the cycle parameter; this post is the most entrepreneurial.
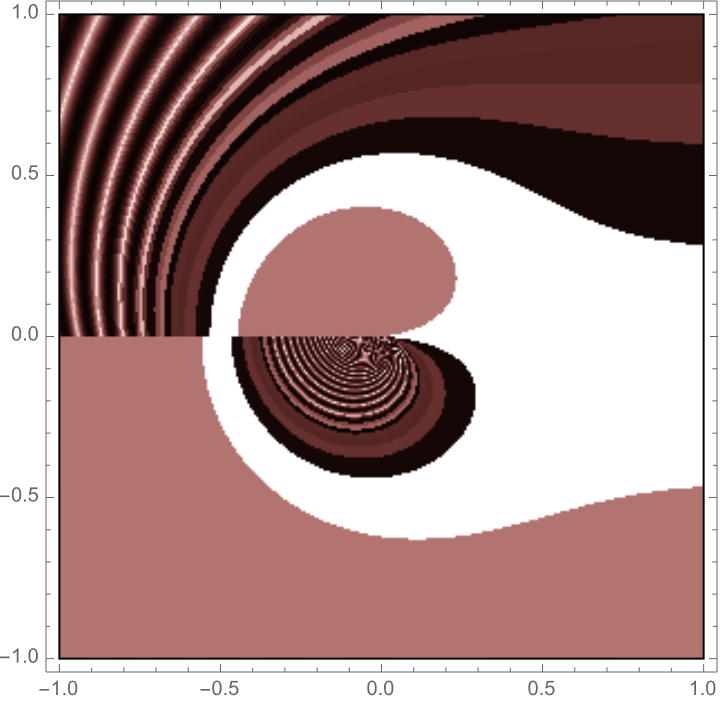
ComplexPlot[
 list2a[[
    With[
     {n = 2 AbsArg[n]},
     Round[(n[[1]])^(n[[2]])]]
    ]][[2]],
 {n, -1 - 1 I, 1 + 1 I},
 ColorFunction -> "CyclicReImLogAbs"]
You see the computational shortest path possible through the directed edges and how you are generating & indexing them..


