Yes, the rainfall plays an important role in malaria epidemiology.
freq := MapThread[{#1, #2, Splice[#3]} &, {(*Year*){"2011", "2012",
"2013", "2014"}, {543, 682, 376,
600}, {{26, 26, 21, 24, 24, 34, 45, 84, 103, 92, 36, 28}, {8, 65,
89, 74, 89, 68, 32, 43, 67, 74, 53, 20}, {9, 12, 37, 27, 48, 23,
45, 27, 37, 35, 58, 18}, {30, 36, 51, 93, 111, 30, 30, 35, 60,
36, 59, 29}}}]
patientfreq := (freq //
Map[ReplacePart[2 -> Nothing]/*(Apply[#1 -> {##2} &])]) //
Apply[Association]
patientsPerMonth :=
KeyValueMap[
Thread[{Map[DateObject/*(#["MonthName"] &)]@
Thread[{ToExpression[#1], Range[12]}], #2}] &, patientfreq]
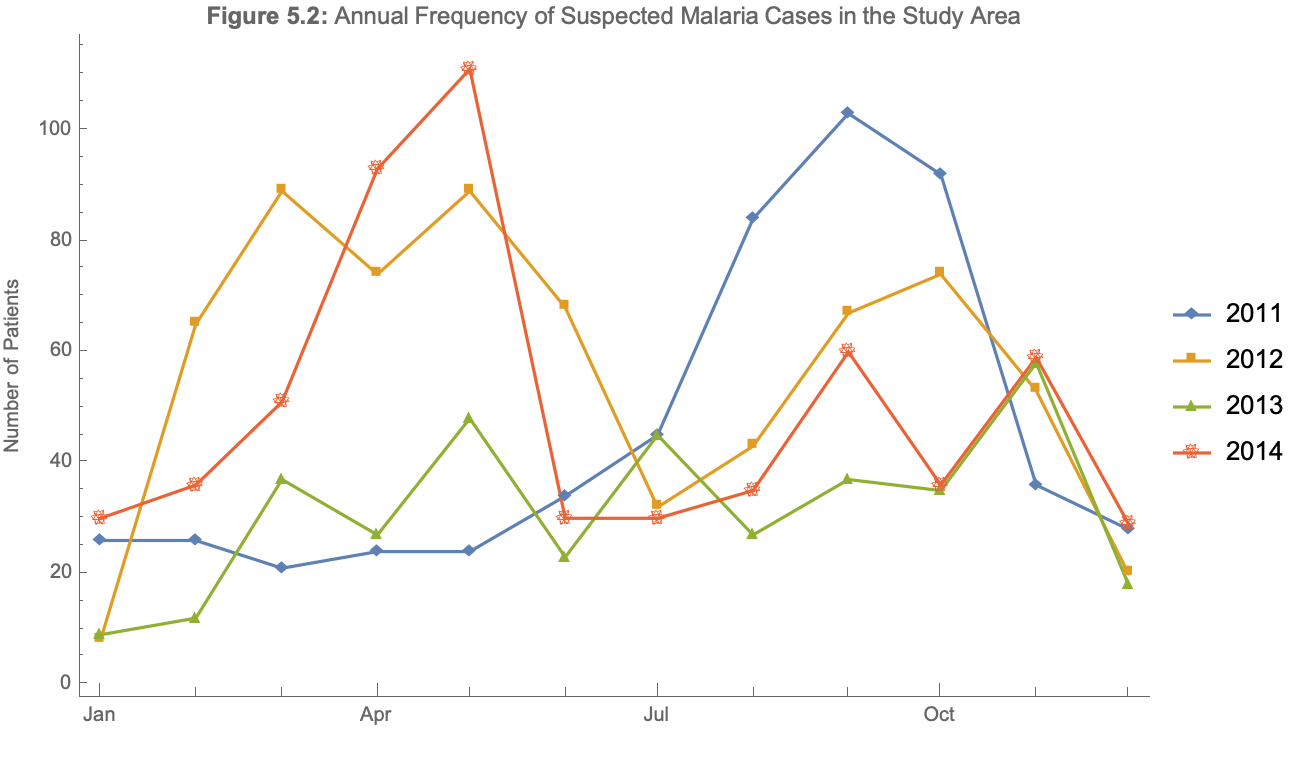
DateListPlot[patientsPerMonth,
PlotLegends -> {"2011", "2012", "2013", "2014"},
PlotMarkers -> {{\[FilledDiamond], 10}, {\[FilledSquare],
10}, {\[FilledUpTriangle], 10}, {\[MathematicaIcon], 10}},
PlotLabel ->
Row[{Style["Figure 5.2:", Bold],
" Annual Frequency of Suspected Malaria Cases in the Study \
Area"}], Frame -> {{True, False}, {True, False}},
FrameLabel -> {"", "Number of Patients"}, Joined -> True,
ImageSize -> Large]
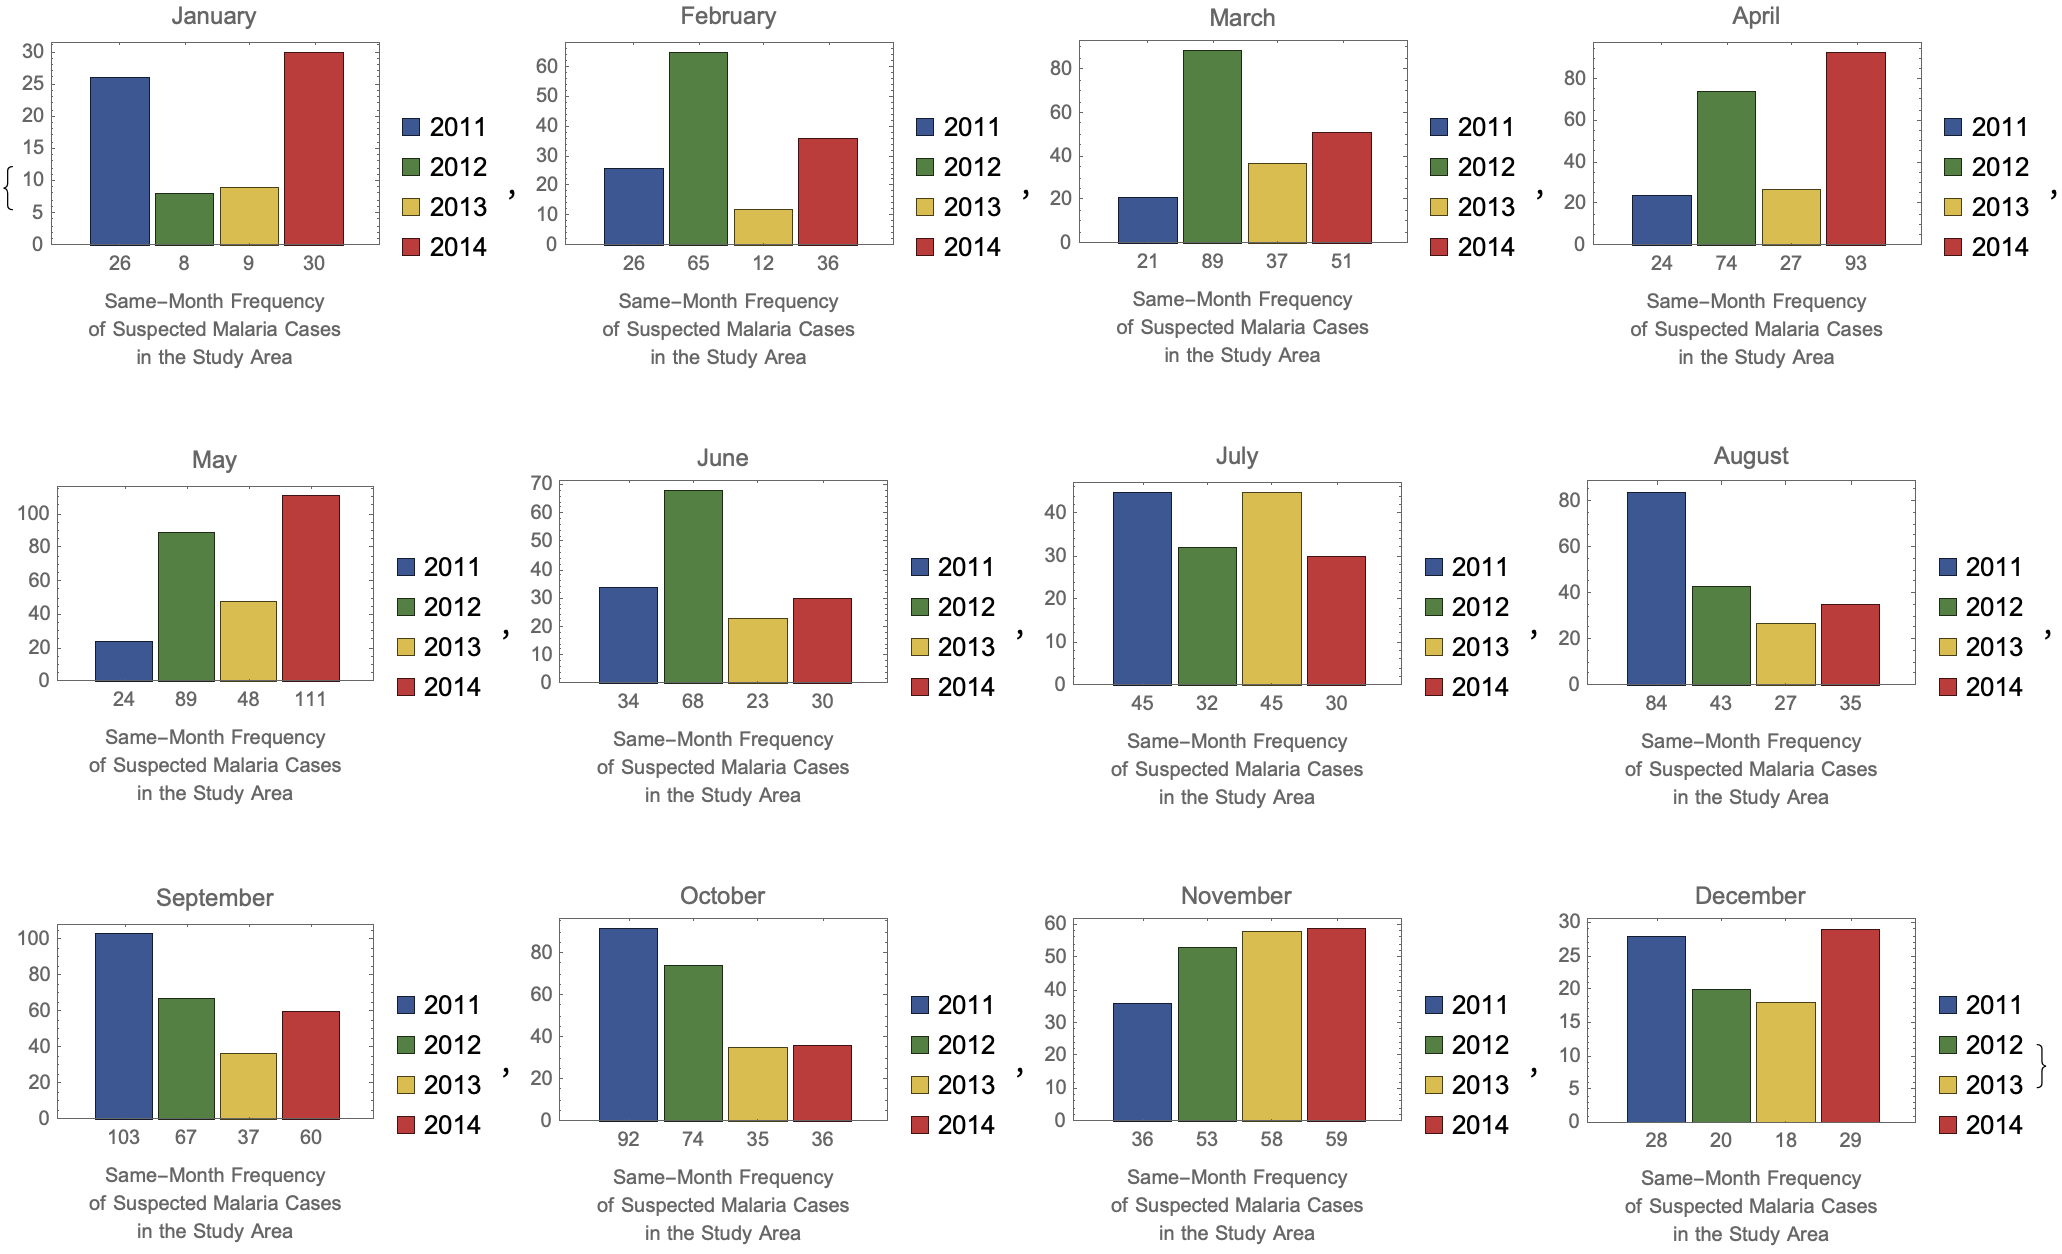
Table[
 BarChart[
  Labeled[#, #] & /@
   Table[patientsPerMonth[[All, index]][[All, 2]][[n]], {n, 4}],
  PlotLabel -> patientsPerMonth[[All, index]][[All, 1]][[1]],
  ChartStyle -> "DarkRainbow",
  ChartLegends -> {"2011", "2012", "2013", "2014"},
  FrameLabel -> {"Same-Month Frequency
of Suspected Malaria Cases
in the Study Area"}, Frame -> True]
 , {index, 1, 12}]
This project, is unconventional and unparalleled. When so you see the malaria and it's getting to be too hectic what when the poverty goes up, environment is in tatters, housing conditions are in ruins, and the health facilities take ages just to find. Welcome to Mubarakpur, an agricultural area where the majority of the population is poor. The data collection source we have, our primary source, is the questionnaire; it's been ages so we've got to do some direct interviews with the local community members. What's our sampling method? Random.
bubblePatientOccupationsList = KeyValueMap[
   {#1, #2["NumberOfHouses"],
     #2["NumberOfPatients"]} &,
   malariaPatientOccupations];
bubblePatientOccupations =
  bubblePatientOccupationsList /. {a_, b_, c_} :> {a, b, c, b/c};
BubbleChart[
 Map[Rest, bubblePatientOccupations],
 ChartStyle -> "Pastel",
 ChartLabels -> Placed[bubblePatientOccupations[[All, 1]], Above],
 FrameLabel -> {"Number of Houses", "Number of Patients"},
 BubbleSizes -> {0.05, 0.2},
 ChartElementFunction -> "PolyhedronBubble"]
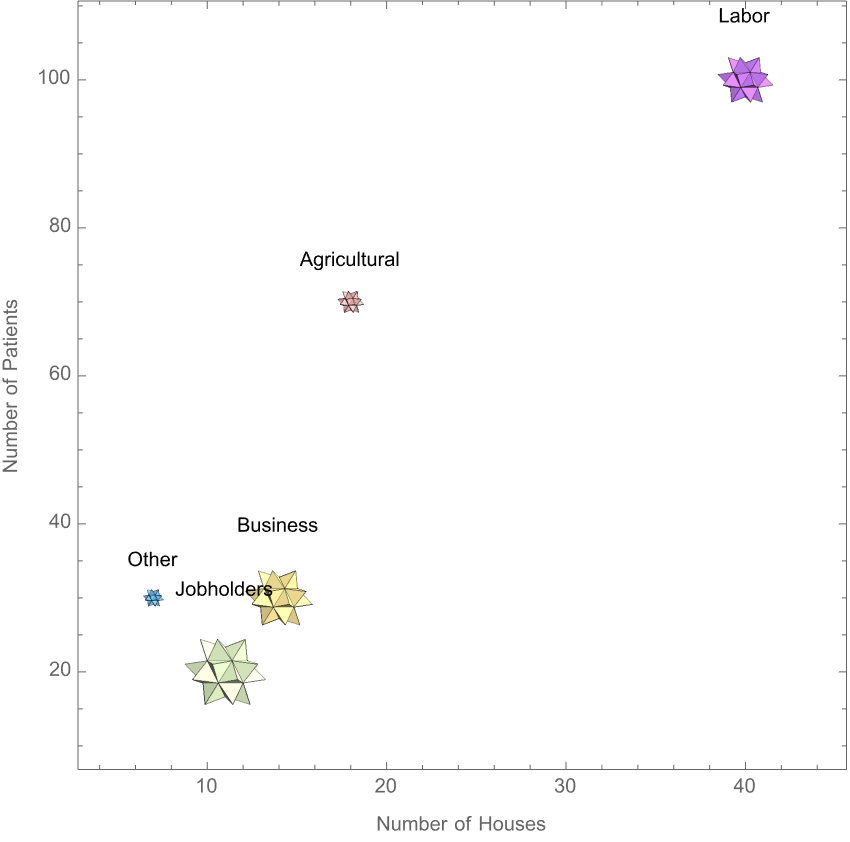
It's remarkable, we could describe the staggering number of malaria cases as a product within the occupation, of number of houses and number of patients. It's prime time for this data, the Population Census Report (1998) where we get all this data on the Bahawalpur Offices of District Health Office and Communicable Disease Control Branch of District Health..on our way to the Bahawalpur Victoria Hospital we can stop by the Civil Hospital..and visit the Rural Health Center of Union Council.
GraphicsGrid[
 {{PieChart[Total /@ confirmedMalariaCases,
    ChartElementFunction -> "SquareWaveSector",
    ChartLabels ->
     Placed[Keys[confirmedMalariaCases], "RadialCallout"],
    PlotLabel -> "Malaria Cases by Gender & Occupation",
    ChartStyle -> "BrightBands",
    PerformanceGoal -> "Quality"],
   SectorChart[Values[malariaPatientOccupations],
    ChartElementFunction -> "SquareWaveSector",
    ChartLabels ->
     Placed[Keys[malariaPatientOccupations], "RadialCallout"],
    ChartStyle -> "Rainbow",
    PerformanceGoal -> "Quality"]}}]
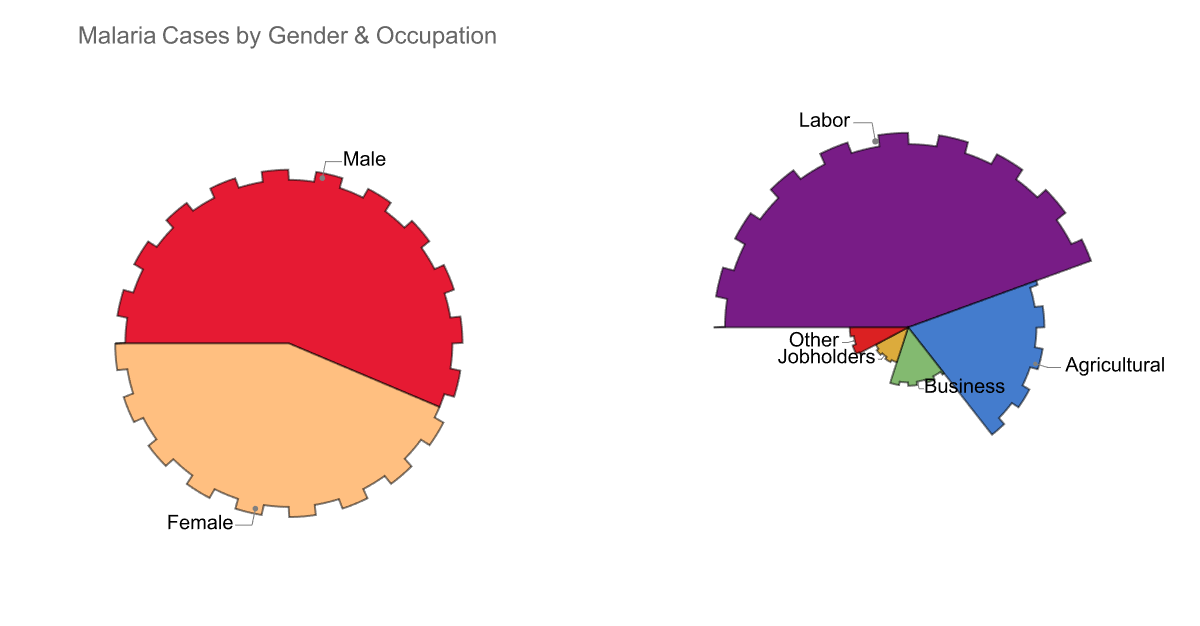
Those are some charts outstanding of the Occupation and the Gender, and their progress around Female, Male, Other Jobholders, Business, Agricultural, and Labor. And we've got the Plasmodium Parasite, when there are open puddles of water in which the worms swim around and then dig underground, through wet gravel, there you will find them. P. vivax, falciparum, malariae, ovale, and in Pakistan prevalently find P. vivax, with 17% P. falciparum in malaria diagnosed cases.
The population, age, sex, education level, occupation, household income, habits, housing conditions, these are the population factors that we've got. The conditions that reduce malaria spread are most astonishingly: High education and family income, better housing conditions. The socio-economically low, poor environment conditions are what make malaria look awfully good in the light of the environmental factors: waste production, unemployment, soil & water pollution, overcrowding followed by an increasing population.
GraphicsGrid[{{DistributionChart[
    Values[confirmedMalariaCases],
    ChartElementFunction -> "HistogramDensity",
    ChartStyle -> "SouthwestColors",
    ChartLabels -> Keys[confirmedMalariaCases],
    PlotLabel -> "Malaria Cases by Age Group"],
   BoxWhiskerChart[
    Values[confirmedMalariaCases],
    ChartElementFunction -> "FadingBoxWhisker",
    ChartLabels -> Keys[confirmedMalariaCases]]}}]
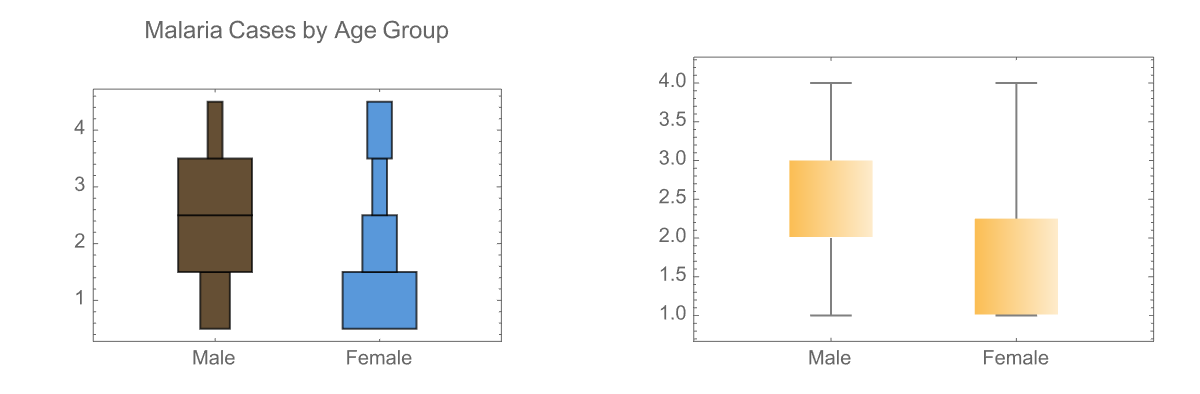
Did we just put the age-wise malaria cases distributions together? Yes we did! We don't need to describe the distribution, however there are age-wise malaria cases where the affected class is all age groups and sexes and it's miraculously prominent in females and there's a high parasitic incidence in males, from the age groups 5-10 and 26-40. The graph itself is sort of stilted toward the lower age groups. When we've got the confirmed malaria data set, it is like we've got the majority of the people set. We've got the labor class, low income with high incidence of malaria due to low income, poor housing, low literacy rates, unawareness.
The Occupation and Malaria chart corresponds to the Age and Gender Group chart, and most ordinarily to the spatial × temporal distribution analysis, the time series analysis of malaria cases based on data from 2011--2014. Our data sources are so diversely prodigious from the Rural Health Units of the study area to the Basic Health Unit Private Hospitals to the Bahawalpur Victoria Hospital to the District Health Office, Bahawalpur.
numberOfHouses = malariaPatientOccupations[[All, "NumberOfHouses"]];
numberOfPatients =
  malariaPatientOccupations[[All, "NumberOfPatients"]];
malariaPatientOccupationsMatrix =
  KeyValueMap[{#1, #2["NumberOfHouses"], #2["NumberOfPatients"]} &,
   malariaPatientOccupations];
correlation =
  Correlation[malariaPatientOccupationsMatrix[[All, 2]],
   malariaPatientOccupationsMatrix[[All, 3]]];
ListPlot[{numberOfHouses, numberOfPatients},
 PlotLabel -> "Correlation: " <> ToString[N[correlation, 3]],
 Ticks -> {None, Automatic},
 PlotLegends -> {"# Houses", "# Patients"}]
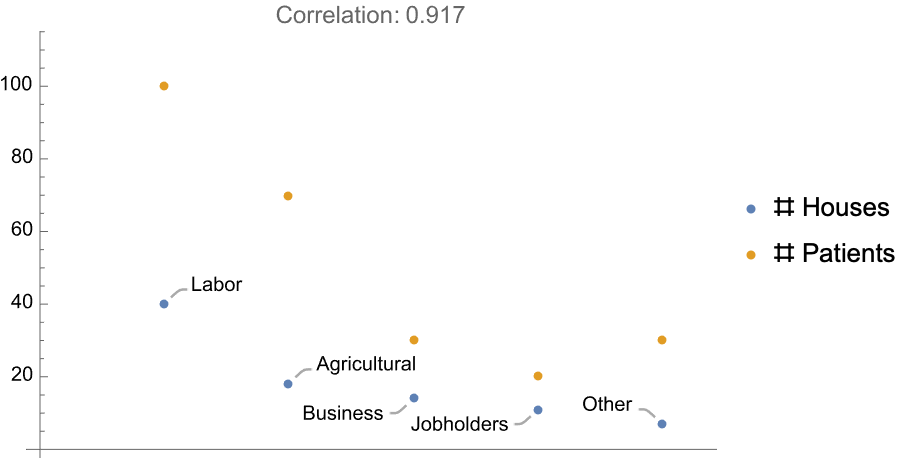
We don't need to look so hard to find the correlation between these number of houses and number of patients anymore, our climactic factors of malaria will always be there; influence both the vectors and the malaria parasite directly or indirectly, they say their land changes and water control are also going to affect the malaria transmission. How? Without loss of meaning, there is an association between suspected malaria cases and rainfall as you said in 2014. The high frequency of malaria in the rainy and summer seasons, which are by the way favorable for mosquito survival, provide the medium for all aquatic stages of mosquito life! It's the increase in relative humidity. Swallow your tongue, pretty soon the relationship between climactic factors, mosquito life changes, and malaria transmission will be clearly illustrated.
ListPlot[
 Transpose[{
   SuspectedMalariaCase["Values"],
   RainFall["Values"]}],
 AxesLabel -> {
   Style["Number of Malaria Cases", FontColor -> GrayLevel[0.3]],
   Style["Rainfall", FontColor -> GrayLevel[0.3]]},
 PlotStyle -> Directive[PointSize[0.02], RGBColor[0.6, 0.2, 0.8]],
 GridLines -> Automatic,
 GridLinesStyle -> Directive[RGBColor[0.6, 0.2, 0.8][0.8], Dotted],
 PlotRangePadding -> Scaled[0.05]]
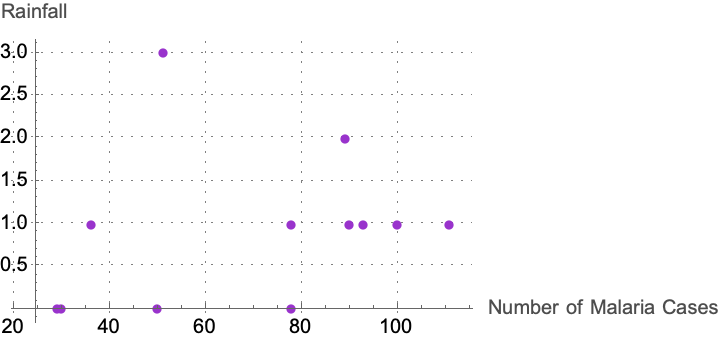
Malaria and Rainfall also often correlates with temperature changes. Malaria transmission, that is is more intense in places where the temperature is sufficiently high to support the malaria parasite who develops in the mosquito (an essential part of the transmission cycle), more quickly when the temperatures are higher. Allow me to explain to you why after the rainy season, the humidity prevents desiccation especially in the earlier stages of the life of the mosquito. There's nothing we can do; unless we properly remain outdoors because there are indoor-biting mosquitoes..and even then we can get away from the mosquitoes, in between rests, in the night when in areas with extremely high rainfall, flooding might wash away breeding sites whereas in very arid areas, even a small amount of rain can create new mosquito breeding sites. And if it's true, then that must have been an astonishing, thing because the malaria parasite development in the mosquito is an essential part of the transmission cycle. Believe me, how would you like it, the increased availability of stagnant water bodies, irrigation, water storage..these things have a hefty weight.


