Message Boards Message Boards

2
|
2899 Views
|
4 Replies
|
9 Total Likes
View groups...
Share
Share this post:

Limit the scope of graphics directives specified for PlotStyle?

Is there an easy way to limit the scope of graphics directives specified for the PlotStyle option of functions such as ListPlot and List LinePlot to just the lines joining the points? The reason I ask is that I'm seeing directives such as Dotted and Dashed applied to unfilled plot markers. Whilst I understand from the documentation that this is the intended behaviour, it's probably not the best default behaviour in most situations --- I can't think of a single occasion on which I've wanted to dash- or dot-style the lines used to draw the plot markers.

The issue is highlighted in the code snippet below.

ListLinePlot[
 Table[Table[{i, i*RandomReal@{1, 4}}, {i, 3}], 10]
 , PlotLegends -> Automatic
 , PlotMarkers -> {Automatic, 10}
 , PlotStyle -> Directive[Dotted]
 ]

This code generates a plot like the one shown below. In this plot, the Dotted PlotStyle, which I really only want to be applied to the lines joining the points, is also being applied to the lines used to draw the unfilled plot markers for plot numbers 6 to 10.

enter image description here

One obvious solution that occurs to me is to explicitly specify the plot markers such that the issue doesn't arise. But I'd rather not have to do this if there's a simple way of stipulating that the PlotStyle should be restricted to the lines joining the points or should not be applied to the lines used to draw the plot markers. Or alternatively that only filled plot markers should be used.

POSTED BY: Ian Williams
4 Replies
Posted 1 year ago

The following solution works, but is way too hacky for my taste:

ListLinePlot[data, PlotLegends -> Automatic, 
 PlotMarkers -> 
  Map[{MapAt[{Dashing[{}], #} &, #, {1}], Offset[10]} &, 
   Charting`CommonDump`GraphicsPlotMarkers[][[All, 1]]], 
 PlotStyle -> Directive[Dotted]]

where I use the internal set of plot markers used by ListPlot[] and ilk. Offset[10] ensures sizes equivalent to the short form {Automatic, 10} in your original snippet.

In any event, you should definitely report this to Support, if you haven't already.

POSTED BY: J. M.

Thanks for the suggestion. I agree it's a bit messy and shouldn't really be necessary. However, using SetOptions makes it cleaner - see below.

SetOptions[#, 
   PlotMarkers -> 
    Map[{MapAt[{Dashing[{}], #} &, #, {1}], Offset[10]} &, 
     Charting`CommonDump`GraphicsPlotMarkers[][[All, 
      1]]]] & /@ {ListPlot, ListLinePlot}

Then you can just do this:

ListLinePlot[
 data
 , PlotLegends -> Automatic
 , PlotStyle -> Directive[Dotted]
 ]

Which I think is a reasonable solution until the issue is addressed by Wolfram.

Thanks again.

POSTED BY: Ian Williams

Hi Robert,

Thanks for your reply. I'm not sure it's a bug as the documentation says PlotStyle 'specifies that a graphics directive g should be used to draw all the main objects in a plot' and that PlotStyle 'can apply to points, lines and surfaces'. These statements suggest that the observed behaviour is intentional. However, it doesn't feel like a great choice and I'd suggest that it would be better for directives such as Dashed and Dotted, when used with PlotStyle in functions such as ListPlot, not to be applied to the styling of lines used to draw the plot markers. Or perhaps add an option such as PlotMarkersStyle which, if specified, could be used to override directives set in PlotStyle.

Thanks again for your feedback and suggestions, it's much appreciated.

All the best,

Ian

POSTED BY: Ian Williams

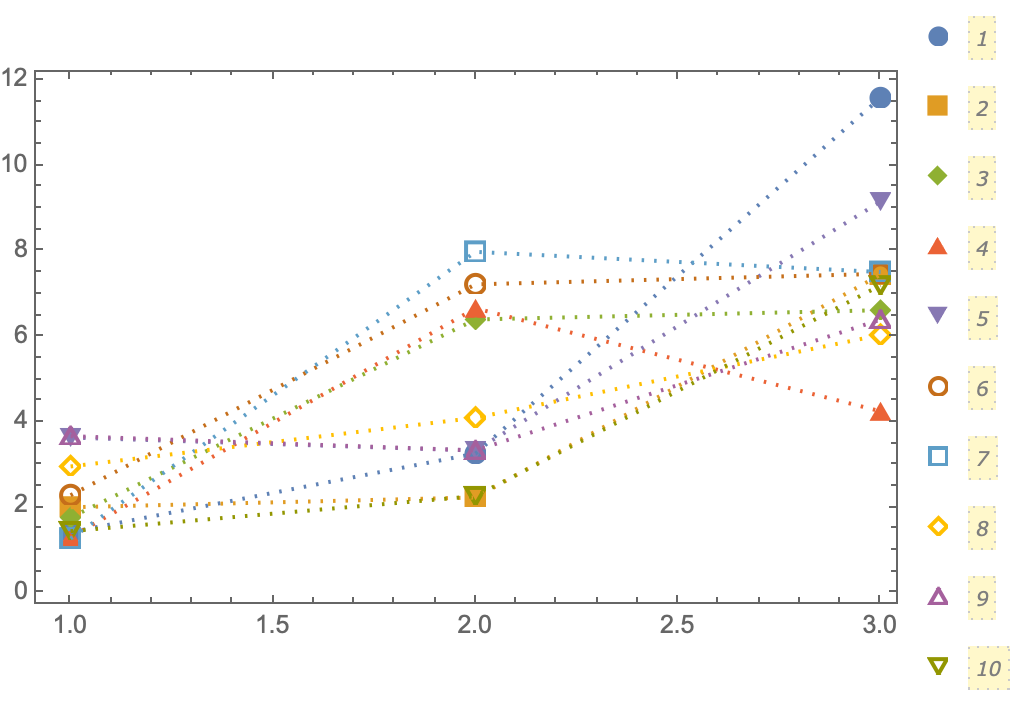
That is really strange behavior, and I consider it a bug.

The easiest work around is to split the work into two parts using Show, putting everything except the lines in the first part, and only the lines in the second.:

data = Table[Table[{i, i*RandomReal@{1, 4}}, {i, 3}], 10];

Show[
 ListPlot[data, PlotLegends -> Automatic, 
  PlotMarkers -> {Automatic, 10}],
 ListLinePlot[data, PlotMarkers -> None, 
  PlotStyle -> Directive[Dotted]]
 ]

enter image description here

What makes the behavior surprising is that there are perfectly good symbols available that would avoid the problem entirely.

ListLinePlot[data, PlotLegends -> Automatic, 
 PlotMarkers -> 
  Thread[{{\[FilledCircle], \[FilledSquare], \[FilledDiamond], 
\[FilledUpTriangle], \[FilledDownTriangle], \[EmptyCircle], 
\[EmptySmallSquare], \[EmptyDiamond], \[EmptyUpTriangle], 
\[EmptyDownTriangle]}, 20}], PlotStyle -> Directive[Dotted]]

enter image description here

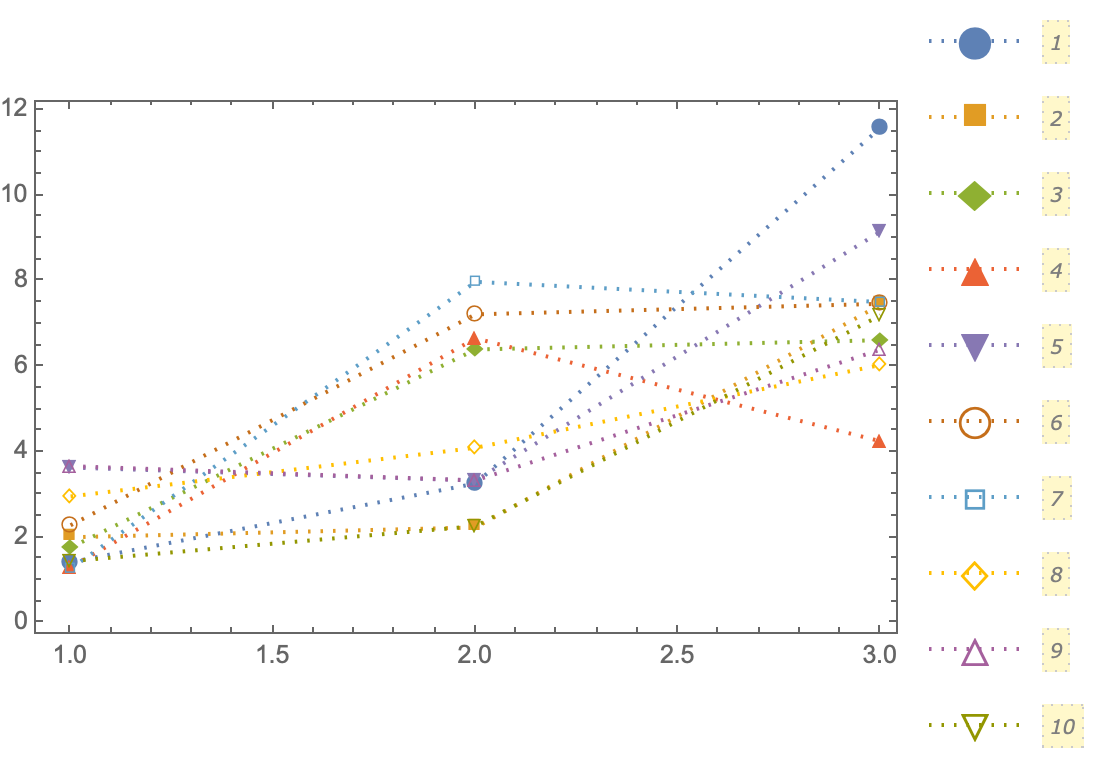
Unfortunately, it looks like there is a bug here. The size of the markers in the plot does not respect the size specification, but does in the legend.

POSTED BY: Robert Nachbar
Reply to this discussion
Community posts can be styled and formatted using the Markdown syntax.
Reply Preview
Attachments
Remove
or Discard

Group Abstract Group Abstract