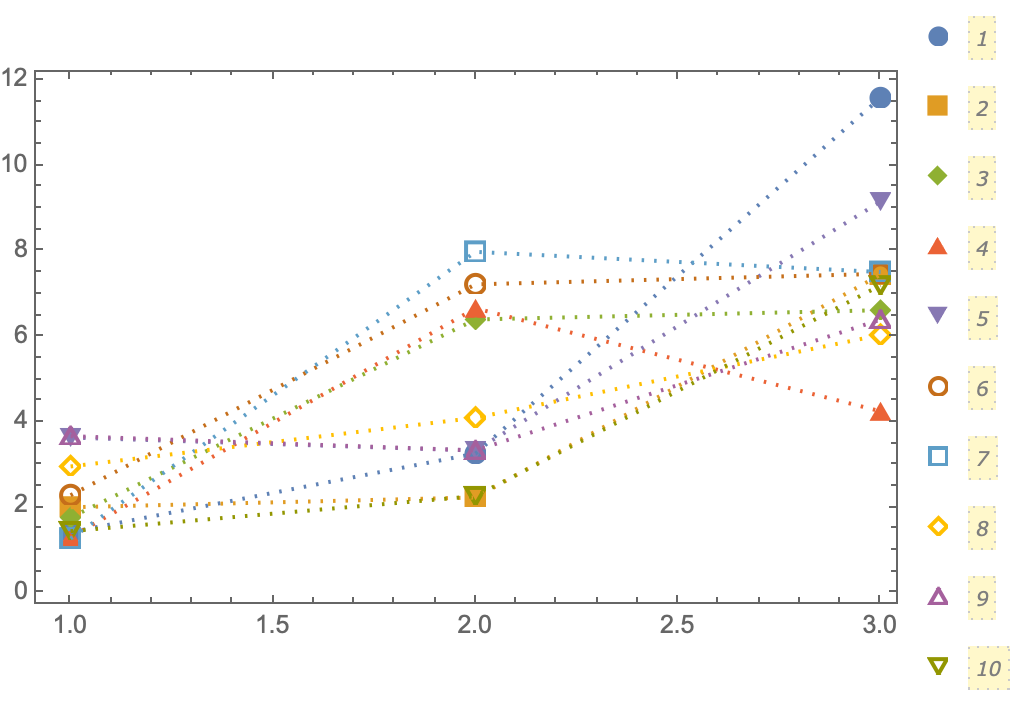
That is really strange behavior, and I consider it a bug.
The easiest work around is to split the work into two parts using Show, putting everything except the lines in the first part, and only the lines in the second.:
data = Table[Table[{i, i*RandomReal@{1, 4}}, {i, 3}], 10];

Show[
 ListPlot[data, PlotLegends -> Automatic,
  PlotMarkers -> {Automatic, 10}],
 ListLinePlot[data, PlotMarkers -> None,
  PlotStyle -> Directive[Dotted]]
 ]

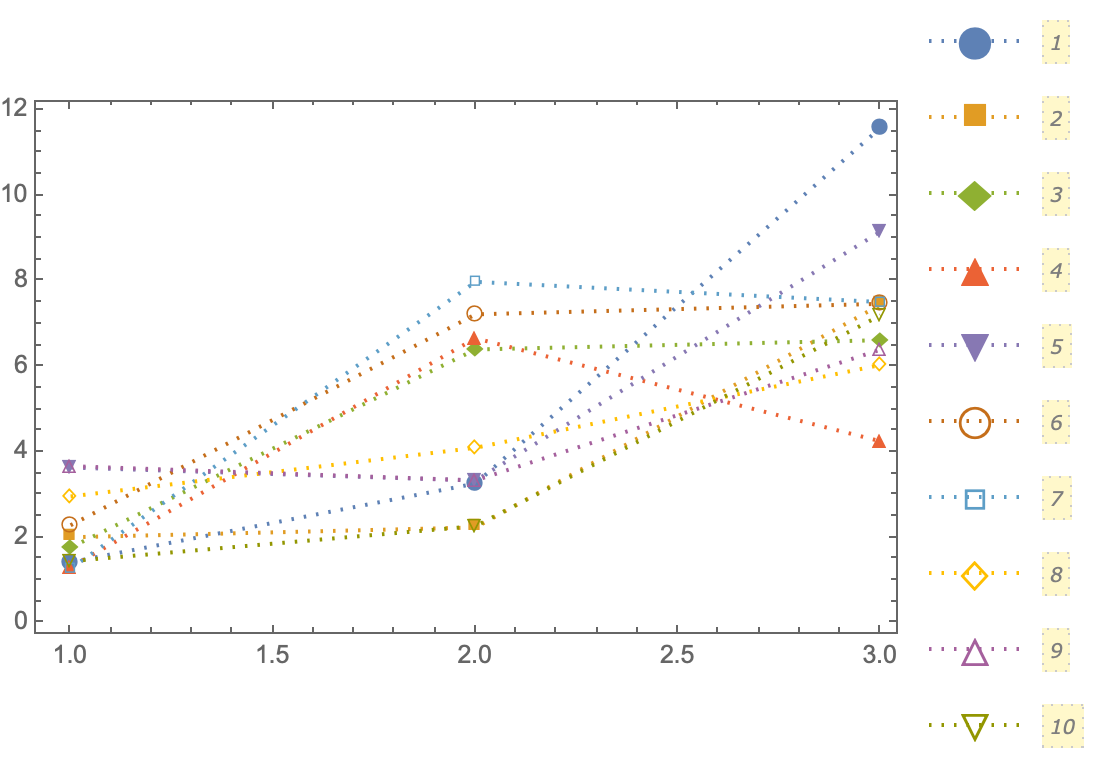
What makes the behavior surprising is that there are perfectly good symbols available that would avoid the problem entirely.
ListLinePlot[data, PlotLegends -> Automatic,
 PlotMarkers ->
  Thread[{{\[FilledCircle], \[FilledSquare], \[FilledDiamond],
\[FilledUpTriangle], \[FilledDownTriangle], \[EmptyCircle],
\[EmptySmallSquare], \[EmptyDiamond], \[EmptyUpTriangle],
\[EmptyDownTriangle]}, 20}], PlotStyle -> Directive[Dotted]]

Unfortunately, it looks like there is a bug here. The size of the markers in the plot does not respect the size specification, but does in the legend.