Message Boards Message Boards

0
|
2357 Views
|
2 Replies
|
1 Total Likes
View groups...
Share
Share this post:

Region Plot using Point data

Posted 2 years ago

So far I use a listplot to create a geometry from a data point. Using the area feature, it requires using the region. Does anyone know how to make a geometry from point data using a region plot?

g = {{2, -0.5}, {4, 1}, {4, 3}, {3, 4}, {1, 4}, {-1, 4}, {-1.5, 
    3}, {-1, 2}, {-0.5, 1}, {-0.5, -0.5}, {2, -0.5}};
ListLinePlot[g]
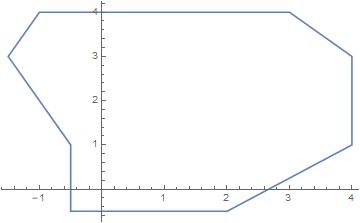
enter image description here

but when I used the area function its not a specific region. enter image description here

thank you

POSTED BY: Abdullah Syafiq
2 Replies

Thank You very much for your help!

POSTED BY: Abdullah Syafiq

Just add a Polygon wrapper to g. You can drop the first point in the list.

Polygon@*Rest@g

enter image description here

POSTED BY: Shenghui Yang
Reply to this discussion
Community posts can be styled and formatted using the Markdown syntax.
Reply Preview
Attachments
Remove
or Discard

Group Abstract Group Abstract