As I said technically you do not need to specify k and m, if you use the following trick:
ContourPlot[p^2/((p^2 - k^2) (p^2 + m^2)) /. k -> 4, {p, -10, 10}, {m, -10, 10}, Frame -> False,
ContourStyle -> Opacity[0.02] , ImagePadding -> False]
gives you a single slice
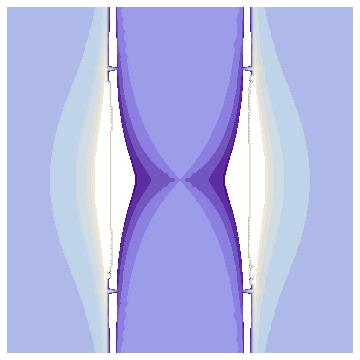
For this slice we set k to 4. If we now construct a list of images using:
imgs = Table[Image[ContourPlot[p^2/((p^2 - k^2) (p^2 + m^2)) /. k -> kc, {p, -10, 10}, {m, -10, 10}, PlotPoints -> 50,
Frame -> False,    ImagePadding -> None, ContourStyle -> Opacity[0.02]]], {kc, -10, 10}];
, we can use Image3D to plot a three dimensional plot, which colour codes the value here in a grayscale:
Image3D[imgs, BoxRatios -> {1, 1, 1}, Background -> White,
ColorFunction -> (GrayLevel[#, 0.05] &)]

You could also try any of these functions:
Image3D[imgs, BoxRatios -> {1, 1, 1}, Background -> White, ColorFunction -> "XRay"]
Image3D[imgs, BoxRatios -> {1, 1, 1}, Background -> White,  ColorFunction -> "LowRange"]
Like so you can circumvent the problem of having to fix any of p, m, k. The trick is basically that you have three independent variables and code the dependent one in gray.
Cheers,
M.
PS: and if you use this command:
imgs = Table[Image[ContourPlot[p^2/((p^2 - k^2) (p^2 + m^2)) /. k -> kc, {p, -10, 10}, {m, -10, 10},
PlotPoints -> 50, Frame -> False, ImagePadding -> None, ContourStyle -> Opacity[0.02]]], {kc, -10.5, 10.5, 1}];
you avoid the problem of k being zero. Unfortunately, then the first of the Image3D I give above does not work anymore and you need to use one of the other two.


