Message Boards Message Boards

0
|
4511 Views
|
2 Replies
|
2 Total Likes
View groups...
Share
Share this post:

How can I plot a graph of data, stored in xls/ods external file?

Posted 10 years ago

I've got the data acquired during the experiment. Now I need just to plot the graph of signal, where y is amplitude in mV, and x is time in s. I need something like the image below, but with the time in the x-axis enter image description here

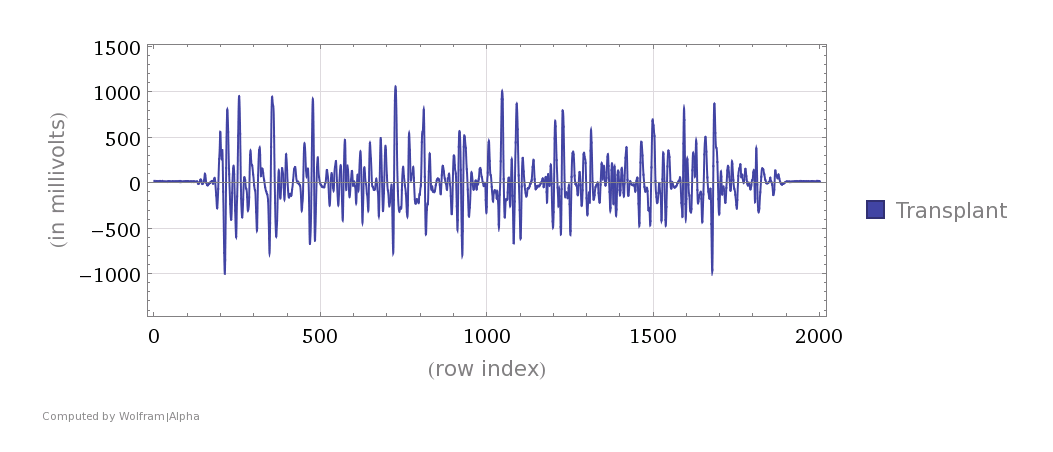
Native = Import["C:\\Users\\Meklon\\Dropbox\\Text\\????\\??????????\\?????????\\\Single_constriction.ods", {"Data", 1, All, 1}]
Transplant = Import["C:\\Users\\Meklon\\Dropbox\\Text\\????\\??????????\\\?????????\\Single_constriction.ods", {"Data", 1, All, 2}]
Time = Import["C:\\Users\\Meklon\\Dropbox\\Text\\????\\??????????\\?????????\\\Single_constriction.ods", {"Data", 1, All, 3}]

How can I use this data with ListLinePlot? All the examples are about functions, not data.

data = Import["Single_constriction.ods", {"Data", 1, All, {2, 3}}]
ListLinePlot[data]

The code above gives me the correct array like this:

{{"20.5078", "0.0798"}, {"18.0664", "0.0799"}, {"15.2588", "0.08"}}

But the ListLinePlot plots nothing. I think the problem is with variable. ListLine function don't use data as variable. Here is the sample of data in the attachment.

Attachments:
POSTED BY: Ivan Gumenyuk
2 Replies

Hi,

would this work:

 ListLinePlot[ToExpression[Transplant], Frame -> True, 
 FrameStyle -> Directive[GrayLevel[ 0.75]], 
 FrameLabel -> {"(row index)", "(in millivolts)"}, 
 FrameTicksStyle -> Directive[FontSize -> 17, FontFamily -> "TimesNewRoman", GrayLevel[0.35]], ImageSize -> Large, 
 LabelStyle -> Directive[FontSize -> 17, Gray, FontFamily -> "TimesNewRoman"], 
 AspectRatio -> 0.45, GridLines -> Automatic, 
 GridLinesStyle -> Directive[LightGray], 
 PlotStyle -> Directive[Thickness[0.0032]],
 PlotRange -> {All, {-1500, 1500}}, 
 PlotLegends -> SwatchLegend[{"Transplant"}, LegendMarkerSize -> 13, 
 LabelStyle -> 
 Directive[FontSize -> 17, FontFamily -> "TimesNewRoman", Gray]]]

I used your import functions. Note that I used the function ToExpression, because the way you import the data makes Mathematica believe that the entries are strings. This is why you see the quotation marks in the output of your array.

enter image description here

Cheers, Marco

POSTED BY: Marco Thiel
Posted 10 years ago

Wonderful, ToExpression is what I needed. It's rather hard to me use this language, as I'm a doctor)) Got something like this: enter image description here

enter image description here

POSTED BY: Ivan Gumenyuk
Reply to this discussion
Community posts can be styled and formatted using the Markdown syntax.
Reply Preview
Attachments
Remove
or Discard

Group Abstract Group Abstract