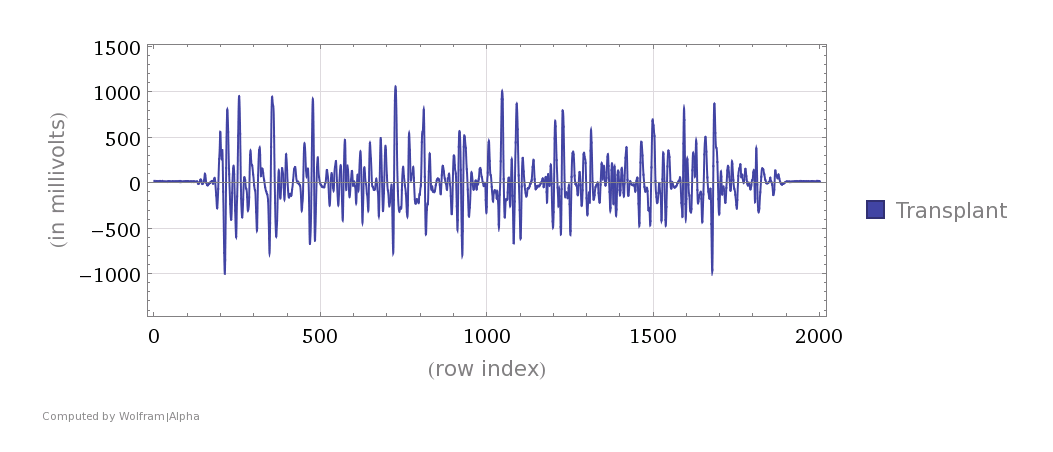
I've got the data acquired during the experiment. Now I need just to plot the graph of signal, where y is amplitude in mV, and x is time in s. I need something like the image below, but with the time in the x-axis 
Native = Import["C:\\Users\\Meklon\\Dropbox\\Text\\????\\??????????\\?????????\\\Single_constriction.ods", {"Data", 1, All, 1}]
Transplant = Import["C:\\Users\\Meklon\\Dropbox\\Text\\????\\??????????\\\?????????\\Single_constriction.ods", {"Data", 1, All, 2}]
Time = Import["C:\\Users\\Meklon\\Dropbox\\Text\\????\\??????????\\?????????\\\Single_constriction.ods", {"Data", 1, All, 3}]
How can I use this data with ListLinePlot? All the examples are about functions, not data.
data = Import["Single_constriction.ods", {"Data", 1, All, {2, 3}}]
ListLinePlot[data]
The code above gives me the correct array like this:
{{"20.5078", "0.0798"}, {"18.0664", "0.0799"}, {"15.2588", "0.08"}}
But the ListLinePlot plots nothing. I think the problem is with variable. ListLine function don't use data as variable. Here is the sample of data in the attachment.
 Attachments: