Message Boards Message Boards

3
|
2272 Views
|
5 Replies
|
15 Total Likes
View groups...
Share
Share this post:

Issue using RegionFunction with ListContourPlot

I've hit a problem using RegionFunction with ListContourPlot and am hoping someone can help.

I'm trying to use RegionFunction with ListContourPlot to suppress the rendering of contours outside a prescribed polygon.

The first example in the attached notebook works as I'd expect. The second does not, in that the contours are drawn outside the specified polygon.

Any suggestions/advice would be much appreciated.

POSTED BY: Ian Williams
5 Replies

Deleted

POSTED BY: Ian Williams

Crossposted here.

POSTED BY: Rohit Namjoshi

Here's an example showing similar behavior, using ListDensityPlot instead of ListContourPlot. (The principles are the same, but it's easier to see what's going on).

We generate some random data and a random polygon. We call ListDensityPlot with the data, and constrain the region with a RegionFunction that is also gathering points based on whether they're inside or outside the region. Mesh->All is turned on so we can easily see the structure of the plot.

SeedRandom[1]; 
d = RandomReal[1, {50, 3}];

poly = Polygon[{{0.21, 0.15}, {0.28, 0.16}, {0.33, 0.24}, {0.41, 0.28}, {0.47, 0.25}, 
    {0.5, 0.19}, {0.57, 0.32}, {0.65, 0.48}, {0.66, 0.64}, {0.60, 0.74}, {0.54, 0.64}, 
    {0.54, 0.72}, {0.56, 0.78}, {0.55, 0.87}, {0.51, 0.9}, {0.42, 0.89}, {0.42, 0.84}, 
    {0.43, 0.75}, {0.42, 0.64}, {0.41, 0.59}, {0.3, 0.6}, {0.25, 0.68}, {0.18, 0.71}, 
    {0.07, 0.67}, {0.1, 0.6}, {0.2, 0.52}, {0.25, 0.48}, {0.2, 0.38}, {0.18, 0.36}, 
    {0.1, 0.27}}]; 

{base, pts} = 
  Reap[ListDensityPlot[d, Mesh -> All, 
    RegionFunction -> 
     Function[{x, y, z}, (Sow[{x, y}, #]; #) &@
       RegionMember[poly, {x, y}]], 
    Epilog -> {EdgeForm[Red], FaceForm[], poly}]];
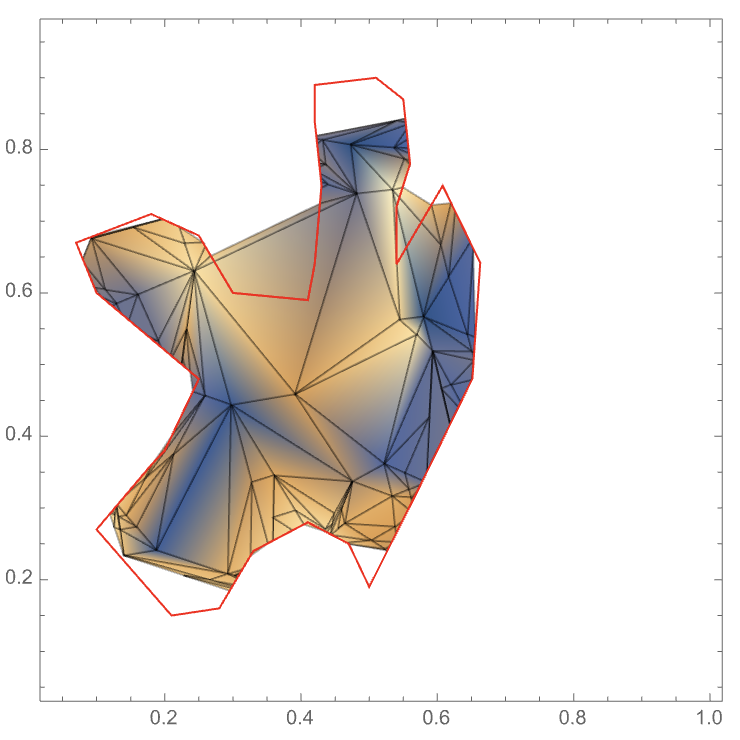
base
enter image description here

Around {0.4,0.6} there's a clear region that is outside the polygon, but still included in the plot -- why?

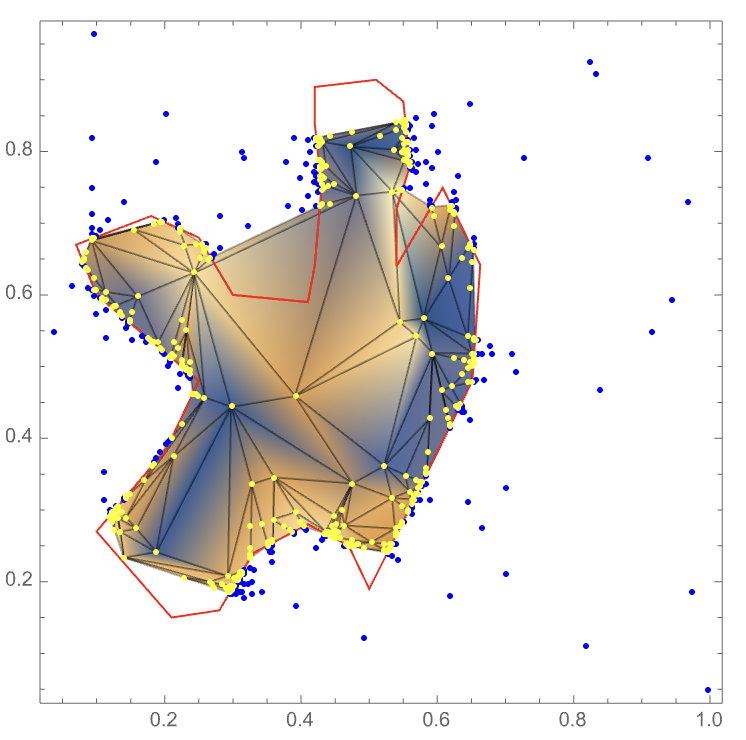
It helps to draw the points the RegionFunction was sampled at, which are either original data points, or come from attempts to resolve the RegionFunction:

Show[base, 
 Epilog -> {EdgeForm[Red], FaceForm[], poly, Blue, Point[First[pts]], 
   Yellow, Point[Last[pts]]}]
enter image description here

Now we're able to understand what is happening. Although our intent was to cut along the edges of the polygon, RegionFunction doesn't actually have that information. It just has a function that says "yes, this point is in the region" or "no, this point is outside the region". For the big triangle (with vertices roughly at {{0.39, 0.46}, {0.48, 0.74}, {0.24, 0.63}}), all three vertices are yellow, which in this case means they're inside the region. Since all the vertices are inside the region, the entire triangle is taken to be in the plot. If some of the vertices were inside and some were outside, then the triangle would be refined to try to find a good representation of the cut created by the RegionFunction. If all the vertices were outside the boundary, the entire triangle would be excluded, possibly leading to gaps inside the region, such as are seen elsewhere in the plot.

POSTED BY: Brett Champion

Thanks Brett,

That's really helpful. The workings of ListContourPlot are starting to become clearer. I also had an answer from Stack Exchange where it was suggested that I should set a largeish value for the optional argument MaxPlotPoints. This seems to be effective (see attached notebook). The only downside is that the selection of a suitable value for MaxPlotPoints is somewhat arbitrary and necessitates a trial-and-error process.

So I've been thinking about an alternative solution. One such possibility when contouring data over a triangulated irregular mesh would be to contour each triangular cell individually and then Show all the contoured cells. In principle this should work. And could potentially provide a fairly robust solution. However, in the attached notebook, I'm seeing some odd results. If you scroll down to the last cell and have a play with the Manipulate, you'll see that the contour colour bands align across some cells but don't align across others - see screenshot below.

enter image description here

I suspect there might be some kind of color function scaling effect going on as the contour lines all seem to align. Any further advice on how to resolve this issue would be much appreciated.

All the best,

Ian

POSTED BY: Ian Williams

Hi Brett,

I've figured out how to build the contour plot on a cell-by-cell basis. Just need to explicitly specify a ColorFunction and set ColorFunctionScaling -> False as per the attached notebook. This seems like a good approach for contouring irregularly spaced data without having to worry about the contours spilling out beyond the mesh boundary. Perhaps it could be built-in?

On another, not unrelated subject, I'm now noticing some unexpected behaviours when I specify values for InterpolationOrder & MaxPlotPoints. My understanding from the documentation is that, for irregularly spaced data, contours can only be derived by linear interpolation. And this does seem to be the case if I don't set a value for MaxPlotPoints. In which case the contours are derived explicitly from the raw point data by a process of linear interpolation on the triangulated mesh. And setting a value for InterpolationOrder has no effect on the contour plot.

So far, so good. But then I give a value for MaxPlotPoints and start to see some unexpected behaviours when also setting a value for InterpolationOrder. These behaviours are illustrated by the examples titled Cases 1-5 in the last section of the attached notebook. In summary, setting InterpolationOrder to Automatic or 1 seems to result in non-linear interpolation whereas setting InterpolationOrder to 3 seems to result in linear interpolation.

It feels like there may be two stages of interpolation happening when a value is given for MaxPlotPoints. However, the methodology isn't clear and the results of specifying a value for InterpolationOrder are the opposite of what I'd expect. Any clarification would be welcome.

Many thanks,

Ian

POSTED BY: Ian Williams
Reply to this discussion
Community posts can be styled and formatted using the Markdown syntax.
Reply Preview
Attachments
Remove
or Discard

Group Abstract Group Abstract