Here's an example showing similar behavior, using ListDensityPlot instead of ListContourPlot. (The principles are the same, but it's easier to see what's going on).
We generate some random data and a random polygon. We call ListDensityPlot with the data, and constrain the region with a RegionFunction that is also gathering points based on whether they're inside or outside the region. Mesh->All is turned on so we can easily see the structure of the plot.
SeedRandom[1];
d = RandomReal[1, {50, 3}];

poly = Polygon[{{0.21, 0.15}, {0.28, 0.16}, {0.33, 0.24}, {0.41, 0.28}, {0.47, 0.25},
    {0.5, 0.19}, {0.57, 0.32}, {0.65, 0.48}, {0.66, 0.64}, {0.60, 0.74}, {0.54, 0.64},
    {0.54, 0.72}, {0.56, 0.78}, {0.55, 0.87}, {0.51, 0.9}, {0.42, 0.89}, {0.42, 0.84},
    {0.43, 0.75}, {0.42, 0.64}, {0.41, 0.59}, {0.3, 0.6}, {0.25, 0.68}, {0.18, 0.71},
    {0.07, 0.67}, {0.1, 0.6}, {0.2, 0.52}, {0.25, 0.48}, {0.2, 0.38}, {0.18, 0.36},
    {0.1, 0.27}}];

{base, pts} =
  Reap[ListDensityPlot[d, Mesh -> All,
    RegionFunction ->
     Function[{x, y, z}, (Sow[{x, y}, #]; #) &@
       RegionMember[poly, {x, y}]],
    Epilog -> {EdgeForm[Red], FaceForm[], poly}]];
base
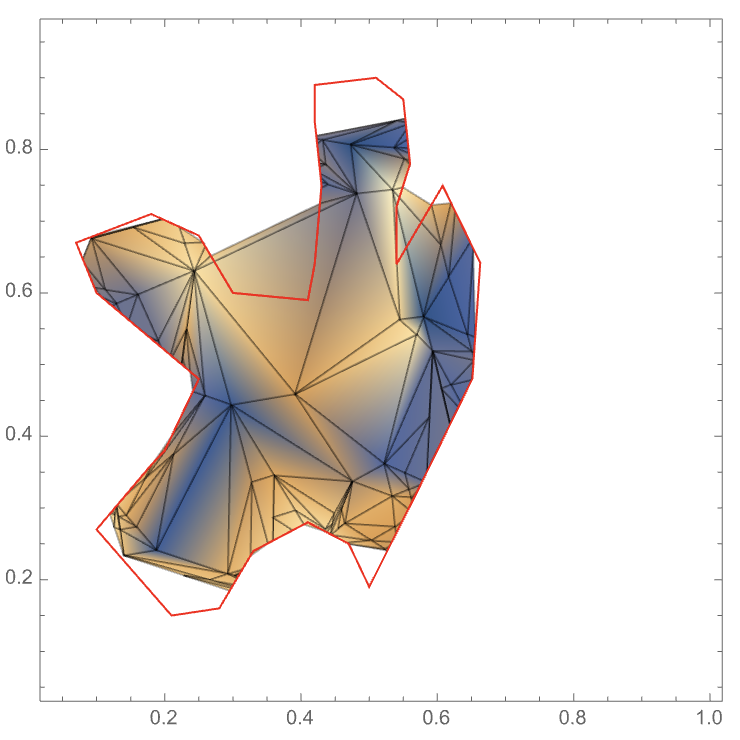
Around {0.4,0.6} there's a clear region that is outside the polygon, but still included in the plot -- why?
It helps to draw the points the RegionFunction was sampled at, which are either original data points, or come from attempts to resolve the RegionFunction:
Show[base,
 Epilog -> {EdgeForm[Red], FaceForm[], poly, Blue, Point[First[pts]],
   Yellow, Point[Last[pts]]}]
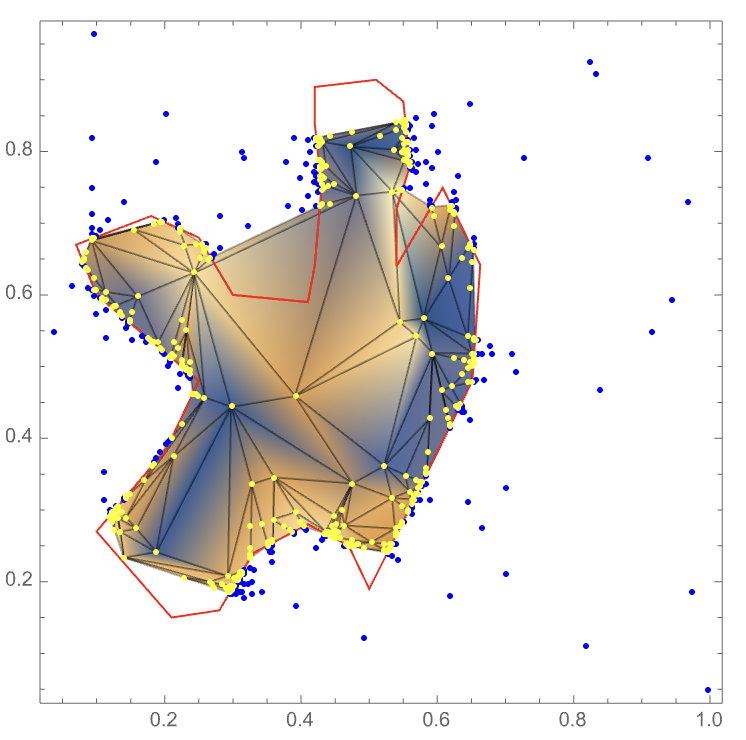
Now we're able to understand what is happening. Although our intent was to cut along the edges of the polygon, RegionFunction doesn't actually have that information. It just has a function that says "yes, this point is in the region" or "no, this point is outside the region". For the big triangle (with vertices roughly at {{0.39, 0.46}, {0.48, 0.74}, {0.24, 0.63}}), all three vertices are yellow, which in this case means they're inside the region. Since all the vertices are inside the region, the entire triangle is taken to be in the plot. If some of the vertices were inside and some were outside, then the triangle would be refined to try to find a good representation of the cut created by the RegionFunction. If all the vertices were outside the boundary, the entire triangle would be excluded, possibly leading to gaps inside the region, such as are seen elsewhere in the plot.


