I thought it might be that Mathematica was missing the phase transition, but problem seems to be across entire (p,T) domain.
Compare output of ThermodynamicData with Diagram of the speed of sound of Water and Steam
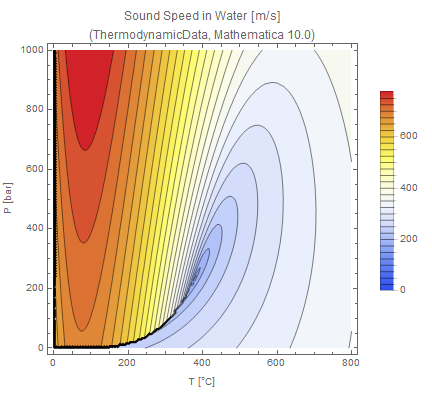
c[p_, t_] := ThermodynamicData["Water", "SoundSpeed", {"Pressure" -> Quantity[p, "Bar"], "Temperature" -> Quantity[t, "DegreeCelsius"]}]; ContourPlot[Evaluate[c[p, t]][[1]], {t, 0, 800}, {p, 0, 1000}, Contours -> 30, Frame -> True, FrameLabel -> {"T [\[Degree]C]", "P [bar]"}, PlotLabel -> "Sound Speed in Water [m/s]\[NewLine](ThermodynamicData, Mathematica 10.0)", PlotLegends -> Automatic, ColorFunction -> (ColorData["TemperatureMap"])]


