Hi,
not sure but this might help:
sol = DSolve[{x y'[x] + 2 y[x] == Sin[x], y[Pi/2] == 1}, y[x], x]

(* {{y[x] -> (-4 + \[Pi]^2 - 4 x Cos[x] + 4 Sin[x])/(4 x^2)}} *)
You can generate the graphs like so:
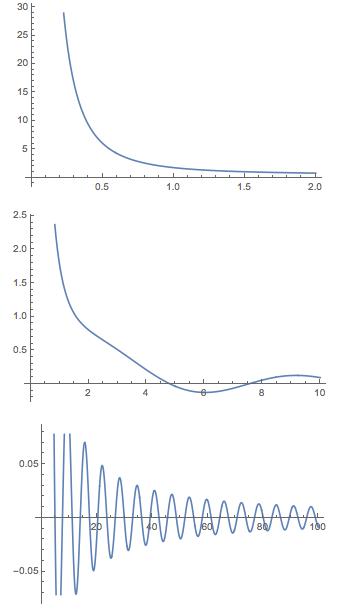
GraphicsColumn[{Plot[y[x] /. sol, {x, 0, 2}],
  Plot[y[x] /. sol, {x, 0, 10}], Plot[y[x] /. sol, {x, 0, 100}]}]
You need to be careful on how to place the brackets, and which ones to use. Also use double equal signs for equations.
Regarding the question about the initial value you might want to have a look at this:
GraphicsColumn[{Plot[{y[x] /. sol, 1}, {x, 0, 2}],
  Plot[{y[x] /. sol, 1}, {x, 0, 10}],
  Plot[{y[x] /. sol, 1}, {x, 0, 100}]}]
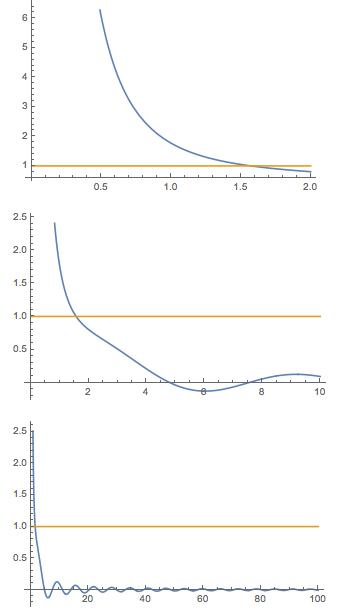
The initial condition is given where the horizontal line intersects with the blue curve. For the limits just type:
Limit[y[x] /. sol, x -> 0]
(* Infinity *)
and
Limit[y[x] /. sol, x -> Infinity]
(* 0 *).
Hope this helps,
Marco


