Message Boards Message Boards

3
|
15288 Views
|
6 Replies
|
7 Total Likes
View groups...
Share
Share this post:

Issues with Mathematica 10 and LogPlot grid lines

Posted 11 years ago

So, today I updated Mathematica 9 to 10 and tried a few .nb I made for the older version to check the differences, but I found some issues in one notebook.

P1 = LogPlot[8/(3 Sqrt[2]*Pi)*(1/x - 1)^(5/2), {x, 0, 1}, PlotRange -> {{0, 1}, {10^-3, 10}}, GridLines -> {{0, 0.1, 0.2, 0.3, 0.4, 0.5, 0.6, 0.7, 0.8, 0.9, 1}, Automatic}, AxesLabel -> {Style[\[Xi], Large], Style[\[Eta], Large]}, Ticks -> {{0, 0.1, 0.2, 0.3, 0.4, 0.5, 0.6, 0.7, 0.8, 0.9, 1}, {0.001, 0.01, 0.1, 1, 10}}, PlotStyle -> {Blue}]

P2 = ListLogPlot[{{0.60302, 0.1284}, {0.85427, 0.01427}, {0.3015, 0.57068}}, PlotStyle -> {Magenta}]

P3 = ListLogPlot[{{0.80402, 0.01298}, {0.60302, 0.0881}, {0.2010, 0.5509}}, PlotStyle -> {Darker[Green]}]

P4 = LogPlot[1, {x, 0, 1}, PlotStyle -> {Red} ]

Needs["ErrorBarLogPlots`"]

P5 = ErrorListLogPlot[{{{0.60302, 0.1284}, ErrorBar[0.002829]}, {{0.85427, 0.01427}, ErrorBar[0.0001189]}, {{0.3015, 0.57068}, ErrorBar[0.003303]}}, PlotStyle -> {Magenta}]

P6 = ErrorListLogPlot[{{{0.80402, 0.01298}, ErrorBar[0.0001198]}, {{0.60302, 0.0881}, ErrorBar[0.001571]}, {{0.2010, 0.5509}, ErrorBar[0.005911]}}, PlotStyle -> {Darker[Green]}]

Show[{P1, P2, P3, P4, P5, P6}]

The final graphic looked like this in Mathematica 9:
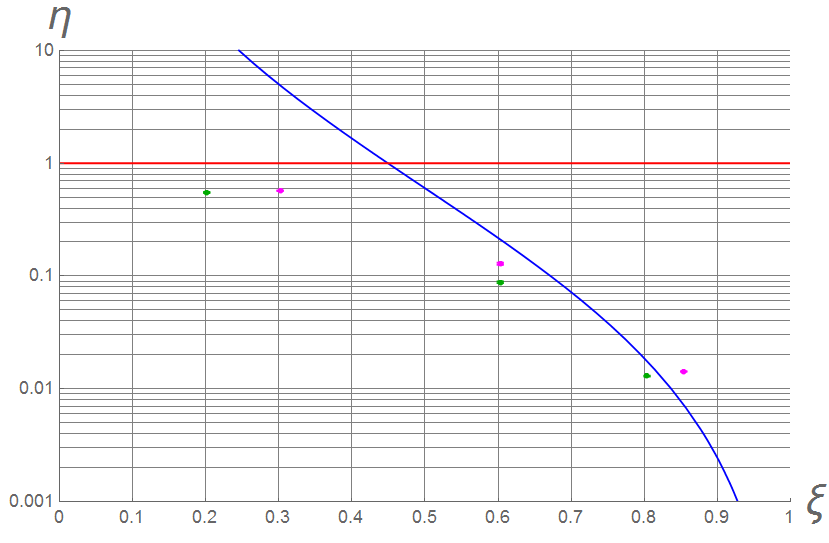
enter image description here

For the same code, now it looks like this:
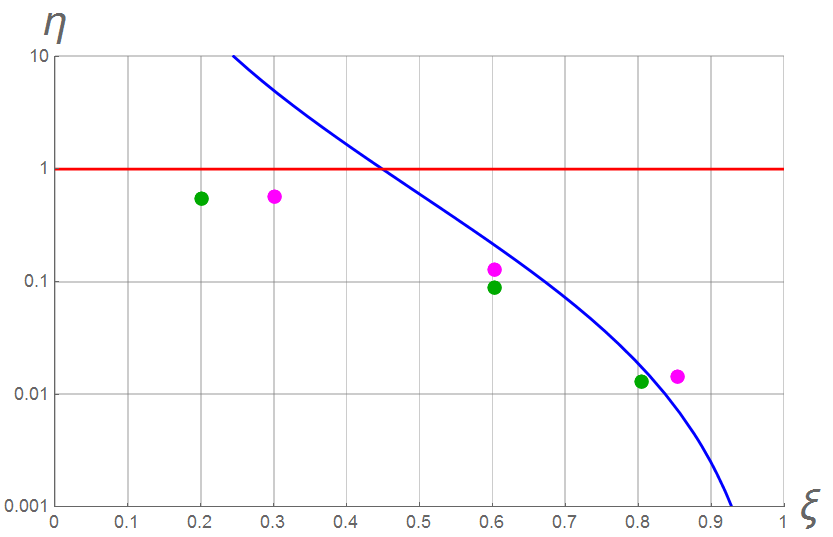
enter image description here

I fixed the grid disappearance manually defining it:

P1 = LogPlot[8/(3 Sqrt[2]*Pi)*(1/x - 1)^(5/2), {x, 0, 1}, PlotRange -> {{0, 1}, {10^-3, 10}}, GridLines -> {{0, 0.1, 0.2, 0.3, 0.4, 0.5, 0.6, 0.7, 0.8, 0.9,1}, {10^-3*2, 10^-3*3, 10^-3*4, 10^-3*5, 10^-3*6, 10^-3*7, 10^-3*8, 10^-3*9, 10^-2, 10^-2*2, 10^-2*3, 10^-2*4, 10^-2*5, 10^-2*6, 10^-2*7, 10^-2*8, 10^-2*9, 10^-1, 10^-1*2, 10^-1*3, 10^-1*4, 10^-1*5, 10^-1*6, 10^-1*7, 10^-1*8, 10^-1*9, 1, 2, 3, 4, 5, 6, 7, 8, 9, 10}}, AxesLabel -> {Style[\[Xi], Large], Style[\[Eta], Large]}, Ticks -> {{0, 0.1, 0.2, 0.3, 0.4, 0.5, 0.6, 0.7, 0.8, 0.9, 1}, {0.001, 0.01, 0.1, 10^0, 10}}, PlotStyle -> {Blue}]

Is there a better way to show the logarithmic grid without defining every single line manually?

By the way, for the size of the points I added PlotStyle -> {PointSize[0.003]} to ListLogPlot and ErrorListLogPlot and apparently that worked: enter image description here
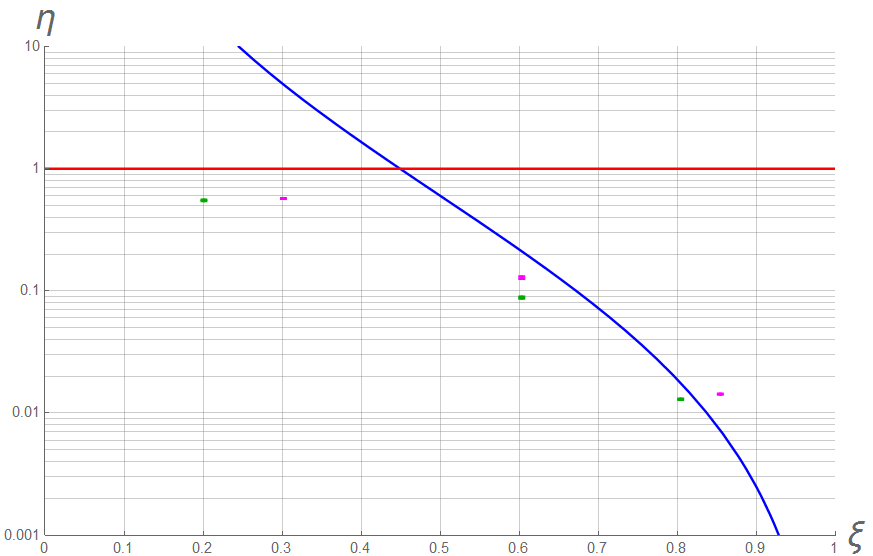
Thank you very much and sorry if my english it's not perfect.

POSTED BY: F. Ríos
6 Replies
Posted 11 years ago

I would also like improvement in this. A simple LogPlot in V9 with GridLines -> Automatic puts lines at majors division on the x-axis and major and minor divisions on the Y (log) axis.

In V10 we get GridLines on major divisions only on both axes.

V10 probably makes more sense, but I would really like to have more control without having to explicitly generate lines. I suggest the options for GridLines be expanded to None, Automatic or All, where All would place GridLines at every axis tick. Since these could be used as GridLines->{Automatic, All} the behavior of V9 could be reacquired at need.

--David

POSTED BY: David Keith

Look up the PlotTheme option and the $PlotTheme global variable. Especially PlotTheme->"Classic", which probably gives what you want.

POSTED BY: Bruce Miller
Posted 11 years ago

I also prefer the behavior of V9. As a general rule I prefer having no grid lines in my plots as they don't convey useful information. However, for log plots I use faint grid lines as they nicely communicate that the plot axis (axes) is logarithmic. The V10 behavior has defeated the only useful reason to include grid lines, in my opinion.

POSTED BY: Ted Cook
Posted 10 years ago

I get the same gridline behavior with or without PlotTheme->"Classic" in V10.

POSTED BY: Ted Cook
Posted 10 years ago

I would really like to see a PlotTheme "Engineering." Engineers often use graphs for more than publication: as working documents for design, and to read values from them.

I suggest the following:

1) Plots are framed.

2) PlotLegends are available.

3) For linear axes, ticks and grid lines are as usual.

4) For log axes:

a) Major ticks and grid lines if automatic are always on the decades.

b) If there is room, minor ticks and grid lines are drawn on the usual 1 through 9 sub-decade divisions.

c) 1 through 9 subdivisions are NEVER spread across more than a decade. If there isn't room to place them in each decade, then they should not be drawn.

d) Major divisions are labeled with the appropriate 10^n label, but if it becomes crowded these labels may be reduced to a fraction of the major divisions. But major divisions always occur at each decade regardless.

I think such plots would be useful for many engineers.

Best regards, David

POSTED BY: David Keith

Hi all,

well, yes: There should be gridlines on more than just on the major divisions.

But isn't the solution as simple as:

GridLines -> {Automatic, Flatten[(Range[9] 10^#) & /@ Range[-4, 0]]}

Regards Henrik

POSTED BY: Henrik Schachner
Reply to this discussion
Community posts can be styled and formatted using the Markdown syntax.
Reply Preview
Attachments
Remove
or Discard

Group Abstract Group Abstract