So, today I updated Mathematica 9 to 10 and tried a few .nb I made for the older version to check the differences, but I found some issues in one notebook.
P1 = LogPlot[8/(3 Sqrt[2]*Pi)*(1/x - 1)^(5/2), {x, 0, 1}, PlotRange -> {{0, 1}, {10^-3, 10}}, GridLines -> {{0, 0.1, 0.2, 0.3, 0.4, 0.5, 0.6, 0.7, 0.8, 0.9, 1}, Automatic}, AxesLabel -> {Style[\[Xi], Large], Style[\[Eta], Large]}, Ticks -> {{0, 0.1, 0.2, 0.3, 0.4, 0.5, 0.6, 0.7, 0.8, 0.9, 1}, {0.001, 0.01, 0.1, 1, 10}}, PlotStyle -> {Blue}]

P2 = ListLogPlot[{{0.60302, 0.1284}, {0.85427, 0.01427}, {0.3015, 0.57068}}, PlotStyle -> {Magenta}]

P3 = ListLogPlot[{{0.80402, 0.01298}, {0.60302, 0.0881}, {0.2010, 0.5509}}, PlotStyle -> {Darker[Green]}]

P4 = LogPlot[1, {x, 0, 1}, PlotStyle -> {Red} ]

Needs["ErrorBarLogPlots`"]

P5 = ErrorListLogPlot[{{{0.60302, 0.1284}, ErrorBar[0.002829]}, {{0.85427, 0.01427}, ErrorBar[0.0001189]}, {{0.3015, 0.57068}, ErrorBar[0.003303]}}, PlotStyle -> {Magenta}]

P6 = ErrorListLogPlot[{{{0.80402, 0.01298}, ErrorBar[0.0001198]}, {{0.60302, 0.0881}, ErrorBar[0.001571]}, {{0.2010, 0.5509}, ErrorBar[0.005911]}}, PlotStyle -> {Darker[Green]}]

Show[{P1, P2, P3, P4, P5, P6}]
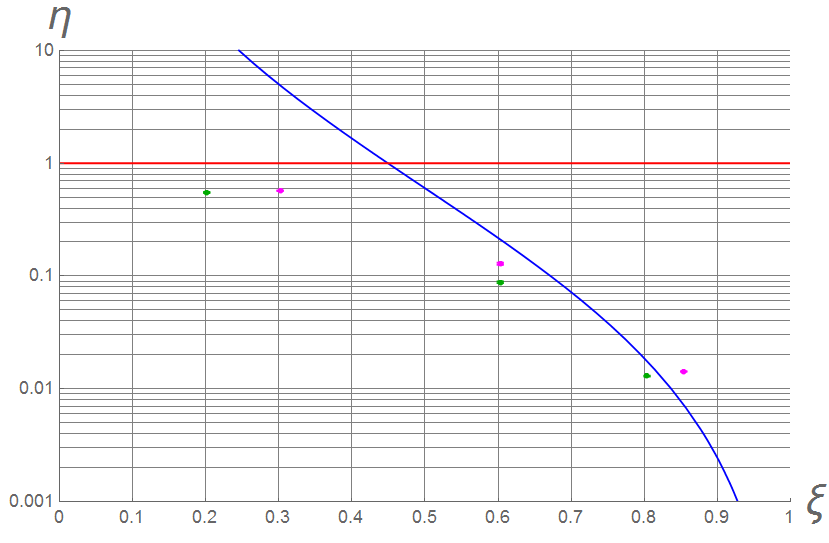
The final graphic looked like this in Mathematica 9:

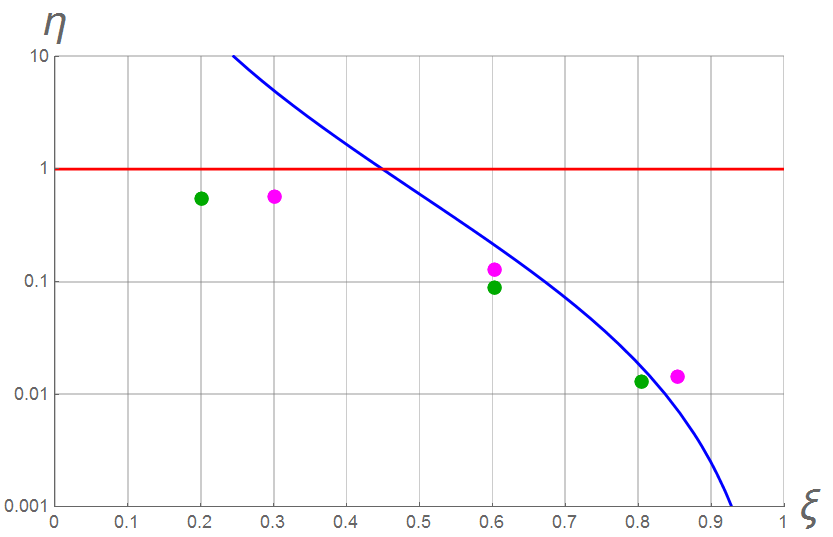
For the same code, now it looks like this:

I fixed the grid disappearance manually defining it:
P1 = LogPlot[8/(3 Sqrt[2]*Pi)*(1/x - 1)^(5/2), {x, 0, 1}, PlotRange -> {{0, 1}, {10^-3, 10}}, GridLines -> {{0, 0.1, 0.2, 0.3, 0.4, 0.5, 0.6, 0.7, 0.8, 0.9,1}, {10^-3*2, 10^-3*3, 10^-3*4, 10^-3*5, 10^-3*6, 10^-3*7, 10^-3*8, 10^-3*9, 10^-2, 10^-2*2, 10^-2*3, 10^-2*4, 10^-2*5, 10^-2*6, 10^-2*7, 10^-2*8, 10^-2*9, 10^-1, 10^-1*2, 10^-1*3, 10^-1*4, 10^-1*5, 10^-1*6, 10^-1*7, 10^-1*8, 10^-1*9, 1, 2, 3, 4, 5, 6, 7, 8, 9, 10}}, AxesLabel -> {Style[\[Xi], Large], Style[\[Eta], Large]}, Ticks -> {{0, 0.1, 0.2, 0.3, 0.4, 0.5, 0.6, 0.7, 0.8, 0.9, 1}, {0.001, 0.01, 0.1, 10^0, 10}}, PlotStyle -> {Blue}]
Is there a better way to show the logarithmic grid without defining every single line manually?
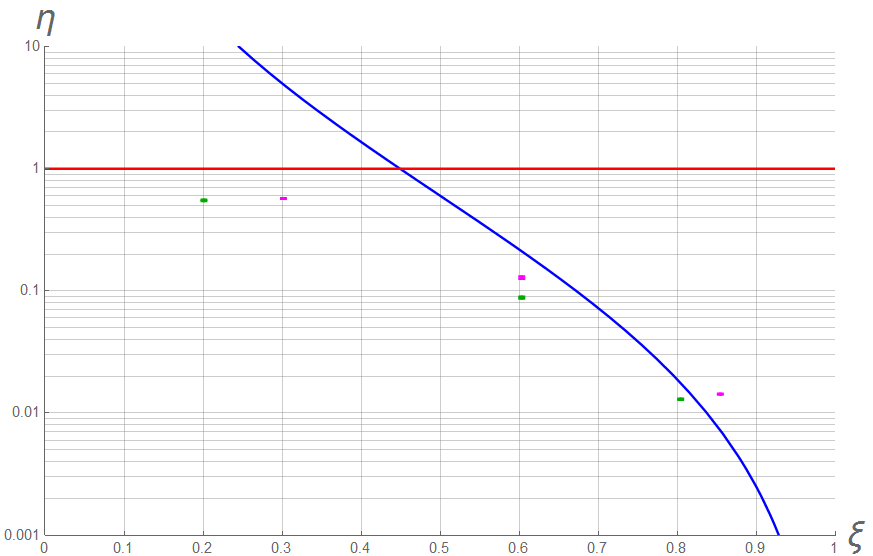
By the way, for the size of the points I added PlotStyle -> {PointSize[0.003]} to ListLogPlot and ErrorListLogPlot and apparently that worked: 
Thank you very much and sorry if my english it's not perfect.