Hi Alex,
I guess you do not need TimeSeriesForecast[] as TimeSeriesModel does already give a forecast. If I really had to, I would do it like so - but under normal circumstances I would not even try! I do not believe that those simple values of the past contain information about the future.
data = {{1952., 8.}, {1956., 8.}, {1960., 13.}, {1964., 10.}, {1968.,
    3.}, {1972., 5.}, {1976., 2.}, {1980., 8.}, {1984., 14.}, {1988.,
    6.}, {1992., 6.}, {1994., 7.}, {1996., 13.}, {1998., 2.}, {2000.,
    13.}, {2002., 4.}, {2004., 10.}, {2006., 5.}, {2008., 8.}, {2010.,
     1.}, {2012., 8.}, {2014., 0.}, {2016., 8.}, {2018., 3.}, {2020.,
    10.}, {2022., 2.}};

dateGold = TimeSeries[{DateObject[{Round@#1}, "Year"], #2} & @@@ data];
train = TimeSeriesWindow[dateGold, {DateObject[{1952}, "Year"], DateObject[{2018}, "Year"]}];
tsm = Quiet@TimeSeriesModelFit[train];
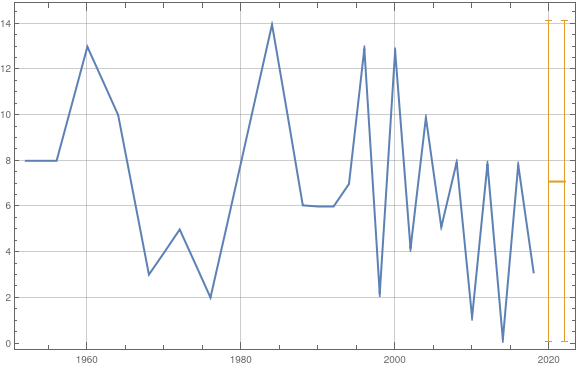
DateListPlot[{tsm["TemporalData"], {#, Around[tsm[#], tsm["PredictionLimits"][#] - tsm[#]]} & /@ {DateObject[{2020}, "Year"], DateObject[{2022}, "Year"]}}, ImageSize -> Large, GridLines -> Automatic]

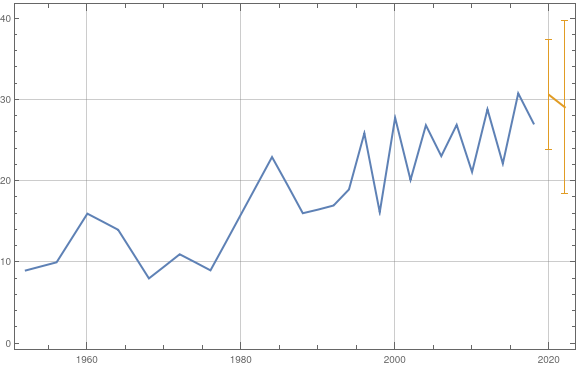
As you see the "forecast" is basically the mean value - with huge error bars, as there is no trend in the data. If you do give your data some trend, then one can see that this approach is trying the best it can do:
data = MapIndexed[{#1[[1]], #1[[2]] + First[#2]} &, data]

Does that help? Regards -- Henrik