Message Boards Message Boards

0
|
2871 Views
|
3 Replies
|
2 Total Likes
View groups...
Share
Share this post:

Estimation of Olympic gold medals for Italy

Posted 1 year ago

Dear All,

According to the data list, Italy has won 10 and 2 Olympic gold medals in 2020 and 2022. I tried to estimate the number of gold medals for these two years using a simple time series model. Is the method correct? I appreciate your time.

data = {{1952., 8.}, {1956., 8.}, {1960., 13.}, {1964., 10.}, {1968., 
    3.}, {1972., 5.}, {1976., 2.}, {1980., 8.}, {1984., 14.}, {1988., 
    6.}, {1992., 6.}, {1994., 7.}, {1996., 13.}, {1998., 2.}, {2000., 
    13.}, {2002., 4.}, {2004., 10.}, {2006., 5.}, {2008., 8.}, {2010.,
     1.}, {2012., 8.}, {2014., 0.}, {2016., 8.}, {2018., 3.}, {2020., 
    10.}, {2022., 2.}};

year = Map[#[[1]] &, data];

gold = Map[#[[2]] &, data];

Length[gold];

train = Take[gold, 24];

Length[train];

tsm = TimeSeriesModelFit[train];

tsm["BestFit"];

for = TimeSeriesForecast[tsm, {2}];
POSTED BY: Alex Teymouri
3 Replies

Hi Alex,

I guess you do not need TimeSeriesForecast[] as TimeSeriesModel does already give a forecast. If I really had to, I would do it like so - but under normal circumstances I would not even try! I do not believe that those simple values of the past contain information about the future.

data = {{1952., 8.}, {1956., 8.}, {1960., 13.}, {1964., 10.}, {1968., 
    3.}, {1972., 5.}, {1976., 2.}, {1980., 8.}, {1984., 14.}, {1988., 
    6.}, {1992., 6.}, {1994., 7.}, {1996., 13.}, {1998., 2.}, {2000., 
    13.}, {2002., 4.}, {2004., 10.}, {2006., 5.}, {2008., 8.}, {2010.,
     1.}, {2012., 8.}, {2014., 0.}, {2016., 8.}, {2018., 3.}, {2020., 
    10.}, {2022., 2.}};

dateGold = TimeSeries[{DateObject[{Round@#1}, "Year"], #2} & @@@ data];
train = TimeSeriesWindow[dateGold, {DateObject[{1952}, "Year"], DateObject[{2018}, "Year"]}];
tsm = Quiet@TimeSeriesModelFit[train];
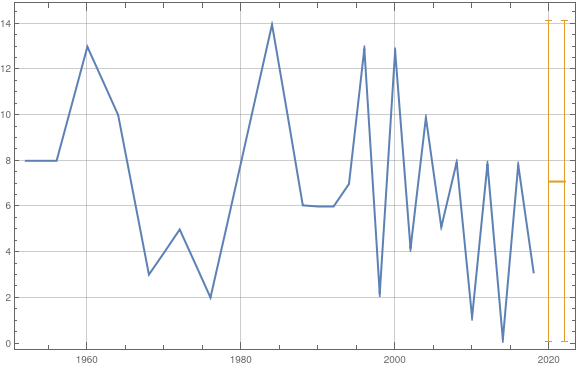
DateListPlot[{tsm["TemporalData"], {#, Around[tsm[#], tsm["PredictionLimits"][#] - tsm[#]]} & /@ {DateObject[{2020}, "Year"], DateObject[{2022}, "Year"]}}, ImageSize -> Large, GridLines -> Automatic]
enter image description here

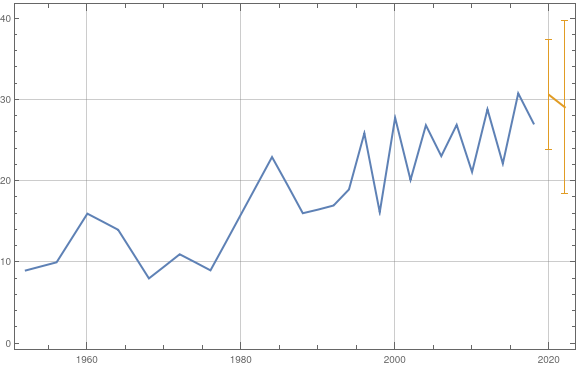
As you see the "forecast" is basically the mean value - with huge error bars, as there is no trend in the data. If you do give your data some trend, then one can see that this approach is trying the best it can do:

data = MapIndexed[{#1[[1]], #1[[2]] + First[#2]} &, data]
enter image description here

Does that help? Regards -- Henrik

POSTED BY: Henrik Schachner

Hi Henrik,

I tried to use Markov process with SequencePredict[] for 2020 as follows:

In[13]:=  SequencePredict[{train}, {{}}]

Out[13]= {8.}

What do you think about this approach? Is acceptable?

Thank you for your help.

POSTED BY: M.A. Ghorbani

Hello Prof. Ghorbani,

I guess for SequencePredict[] you rather need a bunch of sequences ...

Regards -- Henrik

POSTED BY: Henrik Schachner
Reply to this discussion
Community posts can be styled and formatted using the Markdown syntax.
Reply Preview
Attachments
Remove
or Discard

Group Abstract Group Abstract