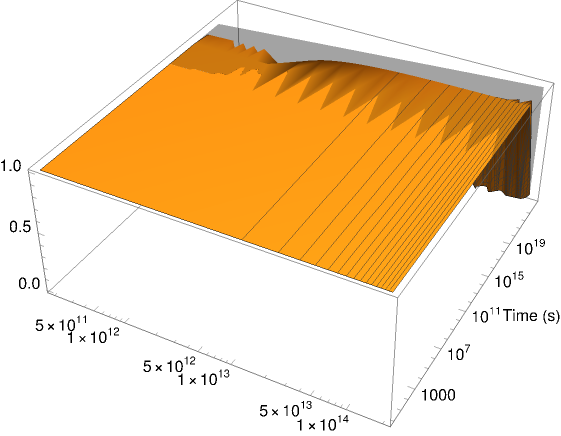
Here are just some thoughts: You can do the plot with logarithmic scaling like so:
Plot3D[tp*Sqrt[1 - ((2*G*M)/r)], {r, 0, 2*10^14}, {M,
  1, (6.5*10^9)*(1.989*10^90)}, AxesLabel -> {" ", "Time (s)"},
 AxesLabel -> {Style["  (m)", Bold, 26], Style["Time (s)", Bold, 16]},
  LabelStyle -> Directive[Black, 16], AxesOrigin -> {0, 0},
 Filling -> {1 -> Top}, PlotRange -> All,
 ScalingFunctions -> {"Log", "Log"}]
Or instead of going to very high values with the arguments you simply go straight to infinity - MMA can actually do those plots!
Plot3D[tp*Sqrt[1 - ((2*G*M)/r)], {r, 0, Infinity}, {M, 1, Infinity},
 AxesLabel -> {" ", "Time (s)"},
 AxesLabel -> {Style["  (m)", Bold, 26], Style["Time (s)", Bold, 16]},
  LabelStyle -> Directive[Black, 16], AxesOrigin -> {0, 0},
 Filling -> {1 -> Top}, PlotRange -> All]
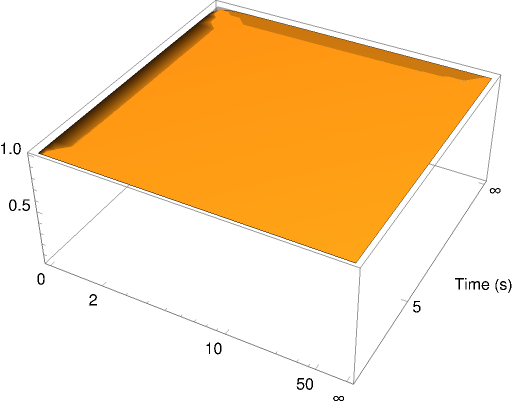
Maybe that might be on option when dealing with those very big numbers anyway.


