Message Boards Message Boards

Extracting Russian casualties in Ukraine data from Mediazona publications

Posted 5 months ago

Attachments:
POSTED BY: Anton Antonov
7 Replies

enter image description here -- you have earned Featured Contributor Badge enter image description here Your exceptional post has been selected for our editorial column Staff Picks http://wolfr.am/StaffPicks and Your Profile is now distinguished by a Featured Contributor Badge and is displayed on the Featured Contributor Board. Thank you!

POSTED BY: Moderation Team

Dear Anton,

This is the best tool for extracting data in the field of water engineering. Congrats.

Thank you so much for sharing that.

POSTED BY: M.A. Ghorbani

Thank you!

Do you extract data from bar charts? From other types of graphs?

POSTED BY: Anton Antonov

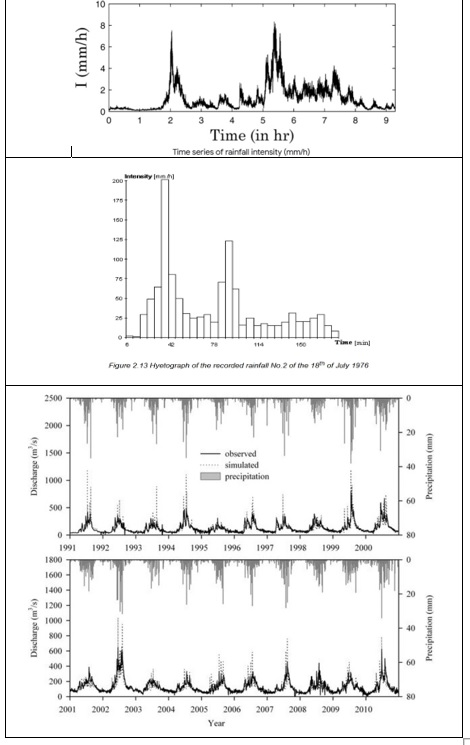
Yes. There are different charts for precipitation, river flow, air temperature, water quality, sea level variation, drought changes, and so on. I attached an example of these charts here. Sometimes we extract needed data using digitization. Now, with this ability of Mathematica, we can extract the necessary data with high accuracy and faster.

I appreciate your time and effort.

enter image description here

POSTED BY: M.A. Ghorbani

I see.

If you are interested in automatic detection of anomalies, breaks, outlier detection in time series, please, see / browse these videos:

POSTED BY: Anton Antonov

Sorry for the delay, Anton.

Certainly. I forwarded the links to my colleagues at different universities. These codes make the analysis simple and fast.

Thank you !

POSTED BY: M.A. Ghorbani
Reply to this discussion
Community posts can be styled and formatted using the Markdown syntax.
Reply Preview
Attachments
Remove
or Discard

Group Abstract Group Abstract