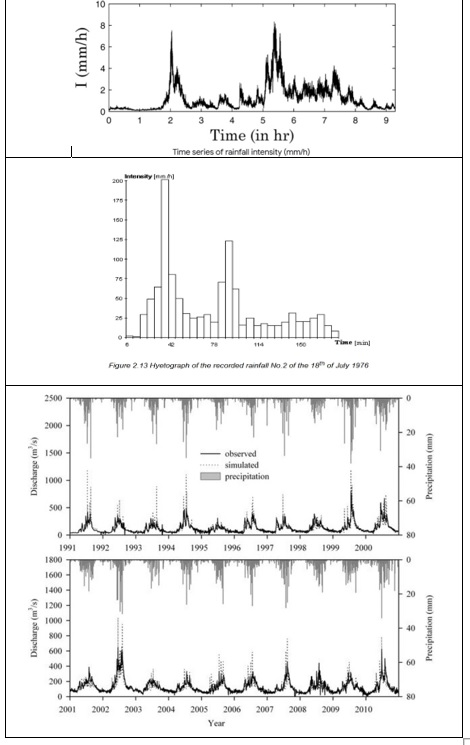
Yes. There are different charts for precipitation, river flow, air temperature, water quality, sea level variation, drought changes, and so on. I attached an example of these charts here.
Sometimes we extract needed data using digitization.
Now, with this ability of Mathematica, we can extract the necessary data with high accuracy and faster.
I appreciate your time and effort.
