Let's start by never capitalizing your symbols, capitalized symbols are reserved for Mathematica.
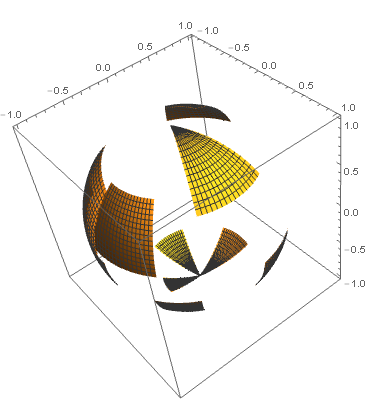
To combine multiple plots use Show[] Next problem is combing plots where the ranges of the axes are different. I defined a null plot with the full range of the axes to be expected from your plots.
null = ParametricPlot3D[{0, 0, 0}, {psi, 0, 2 Pi}, {phi, 0, 2 Pi}];
To make multiple plots change your original plot statement into a function. Instead ot the original delta +/-0.05 I made it an option as 0.05 makes very small areas.
    plot[psiFix_, phiFix_, delta_] :=  ParametricPlot3D[{Cos[psi] Sqrt[1 - Cos[phi]^2],
       Sin[psi] Sqrt[1 - Cos[phi]^2], Cos[phi]}, {psi, psiFix - delta,
       psiFix + delta}, {phi, phiFix - delta, phiFix + delta}]
Make multiple plots in a Table.
surfaces = Table[plot[Random[Real, {0, 2 Pi}], Random[Real, {0, Pi}], Random[Real, {.2, .5}]], {10}];
Display
Show[null, surfaces]
