Message Boards Message Boards

0
|
7223 Views
|
3 Replies
|
2 Total Likes
View groups...
Share
Share this post:

Generate random areas on a sphere and plot them

Posted 11 years ago

Hi Dear community,

I want to randomly distribute spots on a sphere (never mind the degree of randomness for now):

I did the following:

Random choice of coordinates:

Psifix = Random[Real, {0, 2 Pi}]
Phifix = Random[Real, {0, Pi}]

My coordinates:

a[u_, Psi_] = Cos[Psi] Sqrt[1 - Cos[Phi]^2];
b[u_, Psi_] = Sin[Psi] Sqrt[1 - Cos[Phi]^2];
c[u_] = Cos[Phi];

The plotting:

ParametricPlot3D[{Cos[Psi] Sqrt[1 - Cos[Phi]^2], 
  Sin[Psi] Sqrt[1 - Cos[Phi]^2], Cos[Phi]}, {Psi, Psifix - 0.05, 
  Psifix + 0.05}, {Phi, Phifix - 0.05, Phifix + 0.05}]

This spans a surface around the randomly chosen point as a function of theta and phi.

The problem is as follows: I would like to not have one random number but be able to plot let's say 10 of these surfaces meaning that I want an array of Phifix's and Psifix's and find the surface for each of them and plot all of them in one plot .

How would you advice me to do that? I am sorry if it is trivial but I am new to mathematica.

Thanks,

Marcel.

POSTED BY: Marcel Duda
3 Replies
Posted 11 years ago

Let's start by never capitalizing your symbols, capitalized symbols are reserved for Mathematica.

To combine multiple plots use Show[] Next problem is combing plots where the ranges of the axes are different. I defined a null plot with the full range of the axes to be expected from your plots.

null = ParametricPlot3D[{0, 0, 0}, {psi, 0, 2 Pi}, {phi, 0, 2 Pi}];

To make multiple plots change your original plot statement into a function. Instead ot the original delta +/-0.05 I made it an option as 0.05 makes very small areas.

    plot[psiFix_, phiFix_, delta_] :=  ParametricPlot3D[{Cos[psi] Sqrt[1 - Cos[phi]^2],  
       Sin[psi] Sqrt[1 - Cos[phi]^2], Cos[phi]}, {psi, psiFix - delta, 
       psiFix + delta}, {phi, phiFix - delta, phiFix + delta}]

Make multiple plots in a Table.

surfaces = Table[plot[Random[Real, {0, 2 Pi}], Random[Real, {0, Pi}],   Random[Real, {.2, .5}]], {10}];

Display

Show[null, surfaces]
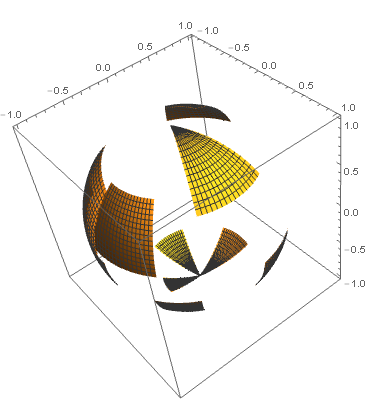
enter image description here

POSTED BY: Douglas Kubler
Posted 11 years ago

I have thought of something new to add points and I tried one of the loop operations:

For[i = 1, i < 11, i++, ParametricPlot3D[{Cos[Psi] Sqrt[1 - Cos[Phi]^2], Sin[Psi] Sqrt[1 - Cos[Phi]^2], Cos[Phi]}, {Psi, Psifix[[i]] - 0.05, Psifix[[i]] + 0.05}, {Phi, Phifix[[i]] - 0.05, Phifix[[i]] + 0.05}]]

So as Psifix and Phifix are a list of values: the "For" should pick out the terms singaly from the list and then do the Parametric plot on them

Unfortunately it does not work, mathematica just does not do anything.

Does this maybe give you ideas?

Thanks,

Marcel.

POSTED BY: Marcel Duda
Posted 11 years ago

Thanks a lot Douglas.

I have made me a happy man.

POSTED BY: Marcel Duda
Reply to this discussion
Community posts can be styled and formatted using the Markdown syntax.
Reply Preview
Attachments
Remove
or Discard

Group Abstract Group Abstract