Group Abstract Group Abstract

Message Boards Message Boards

0
|
8K Views
|
3 Replies
|
2 Total Likes
View groups...
Share
Share this post:

Generate random areas on a sphere and plot them

Posted 11 years ago

Hi Dear community,

I want to randomly distribute spots on a sphere (never mind the degree of randomness for now):

I did the following:

Random choice of coordinates:

Psifix = Random[Real, {0, 2 Pi}]
Phifix = Random[Real, {0, Pi}]

My coordinates:

a[u_, Psi_] = Cos[Psi] Sqrt[1 - Cos[Phi]^2];
b[u_, Psi_] = Sin[Psi] Sqrt[1 - Cos[Phi]^2];
c[u_] = Cos[Phi];

The plotting:

ParametricPlot3D[{Cos[Psi] Sqrt[1 - Cos[Phi]^2], 
  Sin[Psi] Sqrt[1 - Cos[Phi]^2], Cos[Phi]}, {Psi, Psifix - 0.05, 
  Psifix + 0.05}, {Phi, Phifix - 0.05, Phifix + 0.05}]

This spans a surface around the randomly chosen point as a function of theta and phi.

The problem is as follows: I would like to not have one random number but be able to plot let's say 10 of these surfaces meaning that I want an array of Phifix's and Psifix's and find the surface for each of them and plot all of them in one plot .

How would you advice me to do that? I am sorry if it is trivial but I am new to mathematica.

Thanks,

Marcel.

POSTED BY: Marcel Duda
3 Replies
Posted 11 years ago

Thanks a lot Douglas.

I have made me a happy man.

POSTED BY: Marcel Duda
Posted 11 years ago

Let's start by never capitalizing your symbols, capitalized symbols are reserved for Mathematica.

To combine multiple plots use Show[] Next problem is combing plots where the ranges of the axes are different. I defined a null plot with the full range of the axes to be expected from your plots.

null = ParametricPlot3D[{0, 0, 0}, {psi, 0, 2 Pi}, {phi, 0, 2 Pi}];

To make multiple plots change your original plot statement into a function. Instead ot the original delta +/-0.05 I made it an option as 0.05 makes very small areas.

    plot[psiFix_, phiFix_, delta_] :=  ParametricPlot3D[{Cos[psi] Sqrt[1 - Cos[phi]^2],  
       Sin[psi] Sqrt[1 - Cos[phi]^2], Cos[phi]}, {psi, psiFix - delta, 
       psiFix + delta}, {phi, phiFix - delta, phiFix + delta}]

Make multiple plots in a Table.

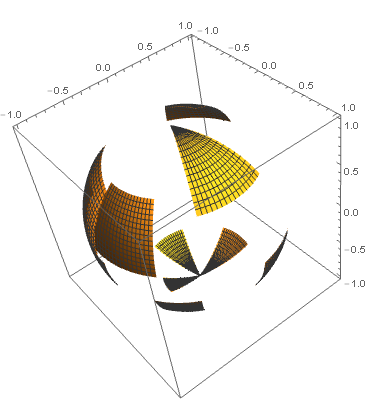
surfaces = Table[plot[Random[Real, {0, 2 Pi}], Random[Real, {0, Pi}],   Random[Real, {.2, .5}]], {10}];

Display

Show[null, surfaces]

enter image description here

POSTED BY: Douglas Kubler
Posted 11 years ago
POSTED BY: Marcel Duda
Reply to this discussion
Community posts can be styled and formatted using the Markdown syntax.
Reply Preview
Attachments
Remove
or Discard