Message Boards Message Boards

0
|
5026 Views
|
3 Replies
|
1 Total Likes
View groups...
Share
Share this post:

Orange coloring scheme of graphics in V10.0

Hello,

How can I restore the default colors of graphics output in V10? I don't like this orange thing :) I suppose it has already been answered but I can't find where.

Thanks a lot, JMC

3 Replies

Please see here for a complete answer:

http://mathematica.stackexchange.com/q/54606/12

POSTED BY: Szabolcs Horvát

Hi Jean-Michel,

it is not quite the same but if you choose the PlotTheme-> "Classic" option that makes the plots look more similar to MMA9. They are not identical though.

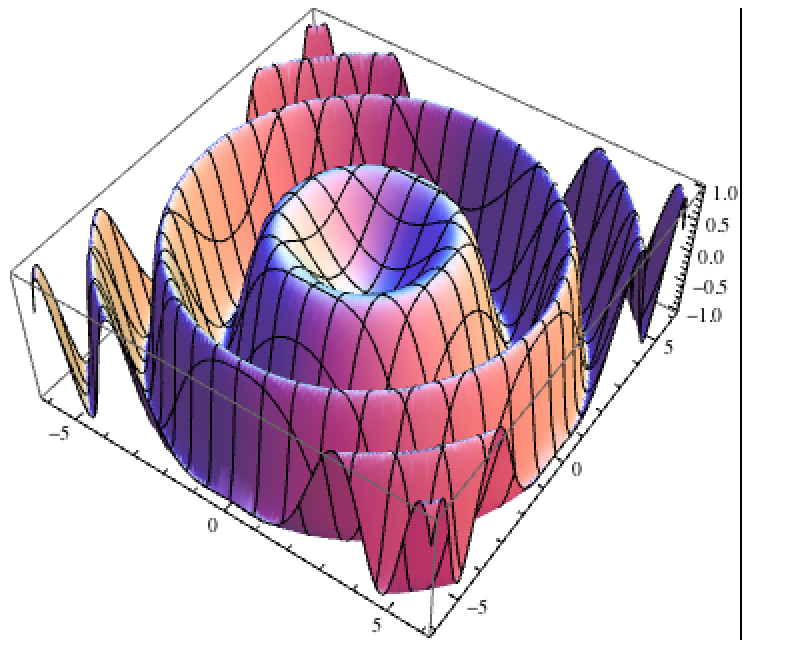
Plot3D[Sin[0.3 (x^2 + y^2)], {x, -6, 6}, {y, -6, 6}, PlotPoints -> 50,PlotTheme -> "Classic"]

gives
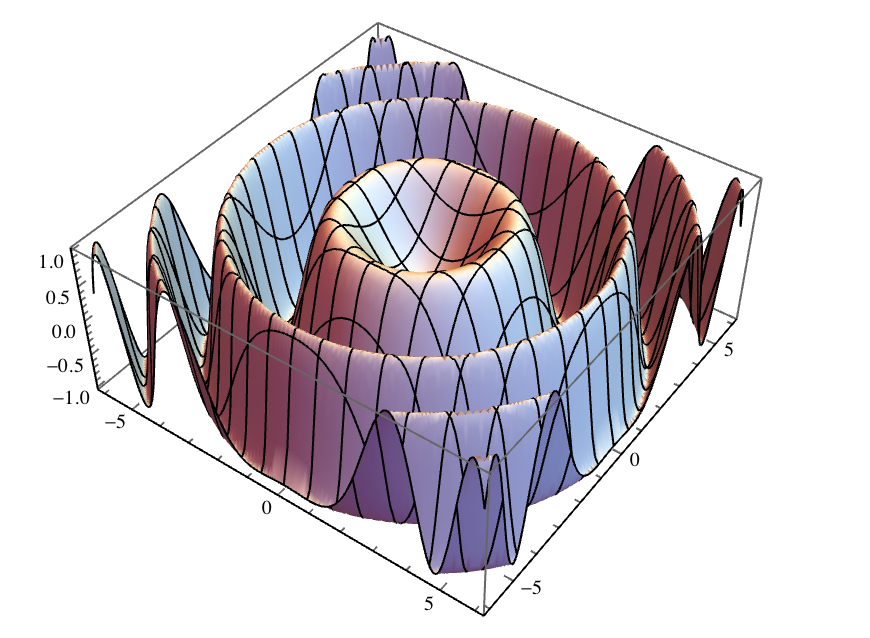
enter image description here

as opposed to

enter image description here

in MMA9, where the colours are move vivid. There are a variety of PlotThemes that you might like.

Cheers, Marco

POSTED BY: Marco Thiel

What "orange thing" do you mean? In 2D graphics the default color is black.

POSTED BY: Jesse Friedman
Reply to this discussion
Community posts can be styled and formatted using the Markdown syntax.
Reply Preview
Attachments
Remove
or Discard

Group Abstract Group Abstract