I am new to Mathematica and Wolfram language, having just downloaded it yesterday.
I am trying to learn more about the vibrations of my CNC in hopes of using this information to help fine tune machining parameters to mitigate chatter.
I am following the example found here... enter link description here
but am having difficulty with the Periodogram graph. I am using a recording of a fan as a test.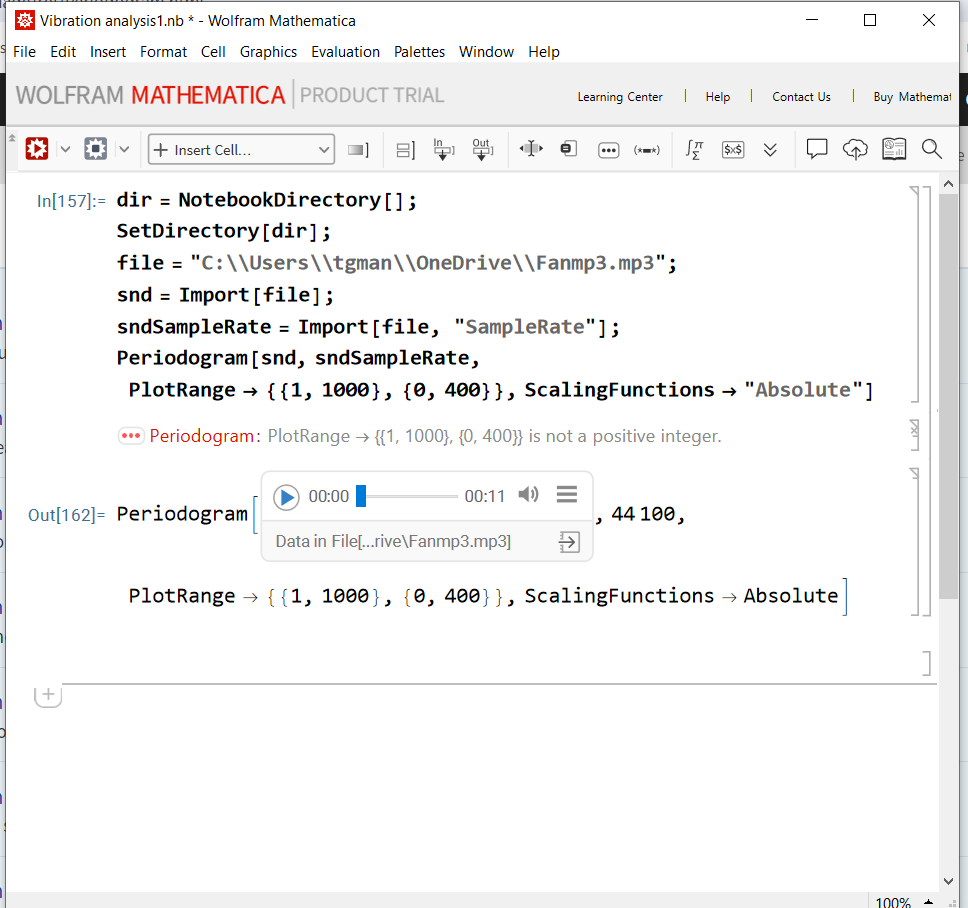
I have attached a screenshot of the error. Any help would be greatly appreciated.


