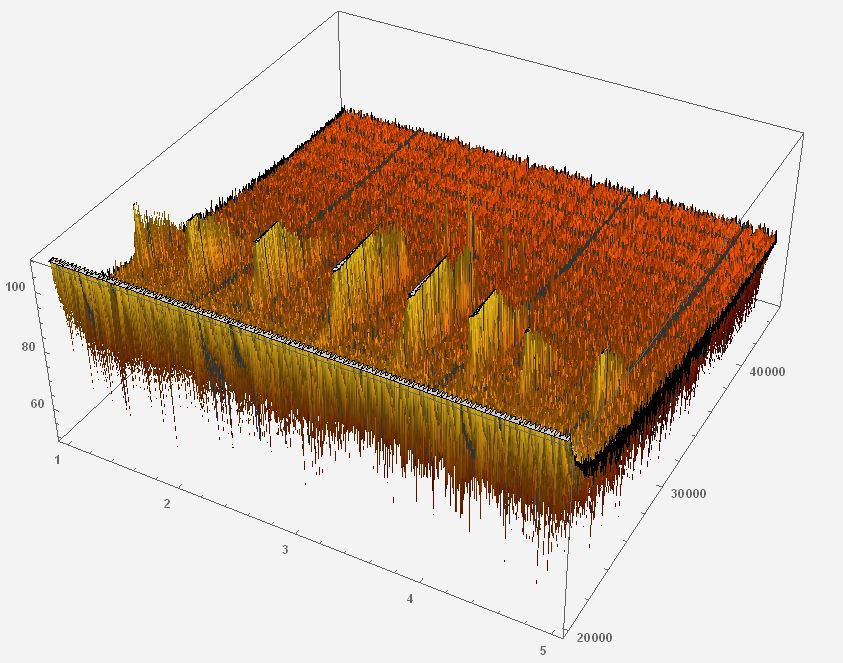
I have been fairly successful in creating 3D spectrograms of Bat Calls that I have recorded, but I appear to be limited by the available memory in the Raspberry Pi (No more memory available. Mathematica kernel has shut down). My wav files are recorded at 32-bit, 192000Hz, and are typically 1s to 5s in duration. I can just about process a 1 second file, but 5 seconds is impossible.
The code I am using is shown below, and it occurs to me that as I am only interested in ultrasound frequencies between say 18000Hz and 96000Hz, there is probably a lot of data that I could throw away to give the Pi an easier ride. My knowledge of Mathematica is extremely limited, so I would be grateful for some help or guidance in how to optimize the sound analysis. I have adapted the code below from what I could find by internet searches. Can I throw away some data? If so, how could I achieve this?
Ideally, I would to increase partSize and offset to values of 2500 to give more detail in the plot (see plot example below using these values on a desktop computer).
snd = Import[/home/pi/bat.wav"];
sndData=snd[[1,1,1]];
sndSampleRate=snd[[1,2]];
min=Min[Abs[Fourier[sndData]]];
partSize=250;
offset=250;
spectroGramData=Take[20*Log10[Abs[Fourier[#]]/min],{2,partSize/2//Floor}]&/@Partition[sndData,partSize,offset];
ListPlot3D[spectroGramData[Transpose],ColorFunction->"Rainbow",DataRange->Round[{{0,Length[sndData]/sndSampleRate},{18000,sndSampleRate/2}},0.1],ImageSize->800,BaseStyle->{FontFamily->"Arial",FontWeight->Bold,12}]

Many thanks in advance.