Group Abstract Group Abstract

Message Boards Message Boards

0
|
2.2K Views
|
19 Replies
|
6 Total Likes
View groups...
Share
Share this post:

BarChart for multilevel nested lists

Posted 11 months ago

Hello, I have a large nested list nl (over 100 nested lists) of nested pairs of elements {{a,b},{{c,d},{e,f},{h,g}}, {{g,h},{e,h}}, {h,i},...} but nested at deeper levels, I like to draw BarChart, but it is not working, it only works when I set a loop, like For i to n, barchart each element (i) of the list, but i want all the nested lists of the pair of elements to be drawn in one Row next to each other with a legend name for each one.
When i Input Barchart[nl], it ignores the input and keeps reprinting my list.
How can i BarChart all the nested lists of the pair of elements, of nl including the deeper levels in one row?
Appreciate any help

Thanking you

POSTED BY: Adam Cherad
19 Replies

Trolling you? why do you assume my time is cheaper than yours? Just forget it, ok, Adios.

Forget it,

POSTED BY: Adam Cherad
Posted 11 months ago

I feel like you're trolling me, but I'll assume that you're not. Among your several posts in this thread, you have provided multiple versions of your data. In the moment, all we have to work with is what you provide us. When you later provide us something different, it's confusing. You seem to expect that we'll just intuit what you really want, and so you seem unwilling to provide explicit (i.e. with actual code instead of text) specifications of what you want. I will try (again) to be as clear as I can about what you've said (I'm copying and pasting exactly from your posts):

At one point you gave us this (which I've named earlierVersionOfData)

earlierVersionOfData = {{{2, 3}}, {{4, 5}, {6, 7}, {9, 8}}, {{{8, 4}, {6, 9}}, {{3, 5}, {5, 2}, {7, 8}}}}

We can use TreeForm to more easily see the structure:

TreeForm[earlierVersionOfData]

enter image description here

It's clearly not totally balanced. In a later post, you provided this (I'm naming the outer list latestVersionOfData and I'm using the set1 convention you used for each day):

set1 = {{2, 7}};
set2 = {{3, 4}, {5, 6}};
set3 = {{7, 8}, {9, 10}, {10, 11}};
set4 = {{2, 3}, {3, 4}};
latestVersionOfData = {{set1}, {set2}, {set3}, {set4}}

Again, let's use TreeForm

TreeForm[latestVersionOfData]

enter image description here

This data is now balanced, but is deeper than it needs to be (and deeper than how your words describe it). Now, here's what I'm assuming you actually have as your data:

ericsVersionOfData = {{{2, 7}}, {{3, 4}, {5, 6}}, {{7, 8}, {9, 10}, {10, 11}}, {{2, 3}, {3, 4}}};
TreeForm[ericsVersionOfData]

enter image description here

Do you now see the difference? And do you maybe now appreciate how actual code is less ambiguous than your text-only descriptions? But regardless, I don't really care, because this is your project and not mine. Have I given you something helpful, or are you still at a loss? Shall we continue this side discussion about why your posts are confusing, or should we move on to actually solving your problem? Up to you.

POSTED BY: Eric Rimbey

Hi Eric
Thanks for taking the time again,
I don't understand why you say
Given a list,

" {{{2, 3}}, {{4, 5}, {6, 7}, {9, 8}}, {{8, 4}, {6, 9}}, {{3, 5}, {5, 2}, {7, 8}}} .... But day 3 doesn't fit the pattern. It looks like that third element is actually two more days' worth of data: a day with 2 readings and a day with 3 readings"

Day 3 readings in this case, is simply as you wrote it, namely: {{3, 5}, {5, 2}, {7, 8}} why doesn't it fit, it is just as explained 3 instrument readings on the day? (there was probably one extra Curley bracket by mistake, also note, that there is no relationship either linear or otherwise, between the readings)
Best,
Adam Cherad

Your new description,

POSTED BY: Adam Cherad
Posted 11 months ago

Well, that sounds much clearer, but it doesn't match what you said previously. Specifically, this

 {{set1}, {set2}, {set3}, {set4}, {set5} ..., {set15}}

is not the same structure as this

{{{2, 3}}, {{4, 5}, {6, 7}, {9, 8}}, {{{8, 4}, {6, 9}}, {{3, 5}, {5, 2}, {7, 8}}}}

Since you indicated that you're struggling with Mathematica syntax, let me digress a moment and make this as explicit as I can. In this expression,

{{{2, 3}}, {{4, 5}, {6, 7}, {9, 8}}, {{{8, 4}, {6, 9}}, {{3, 5}, {5, 2}, {7, 8}}}}

we have a list of 3 elements. That would presumably represent 3 days worth of readings. Day 1 had a reading from a single instrument. Day 2 had readings from 3 instruments. But day 3 doesn't fit the pattern. It looks like that third element is actually two more days worth of data: a day with 2 readings and a day with 3 readings. Do you understand my confusion now?

Your new description,

 {{set1}, {set2}, {set3}, {set4}, {set5} ..., {set15}}

is consistent with what you've described, but there is still some confusion for me, because you've inserted an extra layer of brackets. You've said that set1 is {{2,7}}, and set2 is {{3,4}, {5,6}} and so forth. So, the expression

 {{set1}, {set2}, {set3}, {set4}, {set5} ..., {set15}}

becomes, when fully expanded out,

 {{{{2,7}}}, {{{3,4}, {5,6}}}, {{{7,8}, {9,10}, {10,11}}}, {{{2,3}, {3,4}}}, ... }

Now, maybe that's what your data actually looks like, but it doesn't seem like it should based on your verbal description.

So, because of all of that, I'm going to assume that your data actually looks like this (just 4 days, and I'm going to assign it to a variable so we can easily operate on it):

data = {{{2, 7}}, {{3, 4}, {5, 6}}, {{7, 8}, {9, 10}, {10, 11}}, {{2, 3}, {3, 4}}}

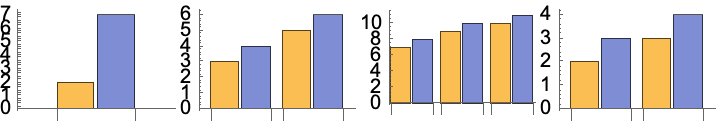
Now, at this point, you could map BarChart over this data, wrap it in a Row and we have something that might be what you want:

Row[BarChart /@ data]

enter image description here

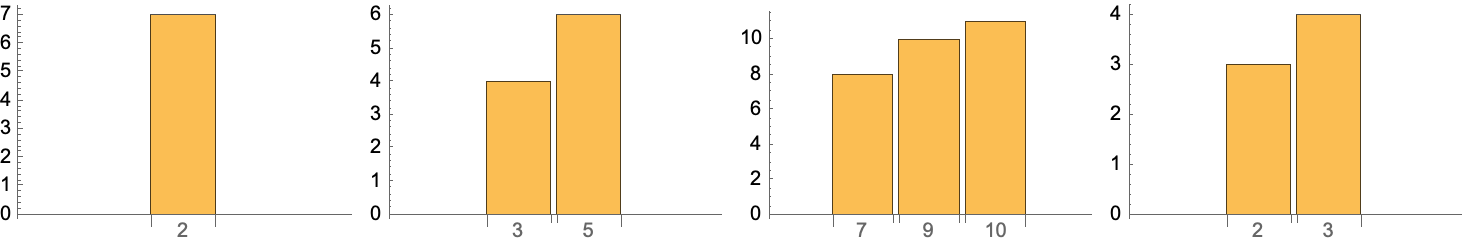
But I'm still confused, because you said that the pairs at the lowest level represent a code and a frequency. Since you have two different semantics within each pair, it doesn't seem like you just want to apply BarChart to it. It sounds like you would want to chart the frequencies and use the code as a label. So, an alternate interpretation might be something like this (I'm switching to Grid because I like its options better):

Grid[{BarChart /@ Map[Apply[Labeled]@*Reverse, data, {-2}]}, Alignment -> {Center, Bottom}]

enter image description here

I hope that helps. Maybe it's not what you want, but maybe it'll help you find your way. If I'm still off the mark, then all I can say is what I've already said: give us a picture or actual data or actual code that gets rid of all the ambiguity inherent in your verbal descriptions.

POSTED BY: Eric Rimbey

Hello Eric
Sorry i was away from my desk for a while.
I relation to what you wrote, please note
My issue is in fact simple, (the difficulty for me is getting used to Mathematica syntax in operation, patterns...etc.), for I had done tons of Pascal coding earlier in my undergraduate work. I say it is simple because all I am presenting is as follows:
I work with generators of either one instrument reading, two readings, or three readings. Each instrument reading gives a pair of outputs, a code, and a frequency.
We may read instruments 5 days in a row, 6 days..., up to 15 days, and at the end of the reading period (from 5 to 15 days) we look at the overall picture.
So if on the day we have only one instrument in operation, I get one pair of readings {{2,7}} for example (say of legend set1)
If 2 instruments are working, I get 2 pairs of reading, {{3,4}, {5,6}} for example (say of legend set2)
If 3 instruments are working on the day, I get 3 pairs of reading {{7,8}, {9,10}, {10,11}} for example (and we label them as legend set3, and the next day i may get only 2 instruments working which would give me {{2,3}, {3,4}} call it set4...etc
In other words,
I end up with a nested list for period of 15 days for instance, of readings looking like:
{{set1}, {set2}, {set3}, {set4}, {set5} ..., {set15}}, . If the period is only 7 days, then the list would only nest 7 sets.

All I want is plot the Bar charts for the working period in a row, so what’s “so absolutely unclear” about this?
Trust it is clearer,
Best
Adam Cherad

POSTED BY: Adam Cherad
Posted 11 months ago

A picture of what? which code? I have nothing of the sort.

You said in your original post:

it only works when I set a loop, like For i to n, barchart each element (i) of the list

That led me to believe that you were able to achieve an approximation of what you want using a for loop. If you just provide us with that code, we can run it ourselves and see what you're trying to achieve. As for a picture, the picture would either be the result of the for loop, or just something you drew yourself to represent what you want. If you know what you want the result to look like for a given input, then you can draw a picture of that or write "fake" code that creates a picture in a hard-coded fashion. Whatever. Just something that reduces the ambiguity.

I hate to belabor this, but you keep saying surprising things. Here is an exact quote of what you just recently said:

{{{2, 3}}, {{4, 5}, {6, 7}, {9, 8}}, {{{8, 4}, {6, 9}}, {{3, 5}, {5, 2}, {7, 8}}}}, this is it! my data is structured in exactly the same way, please consider all single pairs as a nested list as well as i just did to the first one {{2,3}}. My list nl just carries on along the same structure, namely, single pair, 2 pairs, 3 pairs...for over 100 lists. I can't be clearer than this.

Well, maybe you can't be clearer, but this is absolutely, definitely, NOT clear. A list that is "shaped" like "single pair, 2 pairs, 3 pairs, etc" would look like this:

{{{1,2}}, {{3,4}, {5,6}}, {{7,8}, {9,10}, {10,11}}}

but your nl has deeper structure than this. In words, your nl is "single pair, three pairs, a list with two sublists that themselves contain 2 pairs and 3 pairs". I see no obvious pattern here, so I have no idea what to expect next. I have no idea how deep this structure will go.

But now we're just arguing over how clear your language has been to this point. And that really doesn't matter. We're trying to give you suggestions for how to improve your question, but you just keep insisting that you've already been perfectly clear. Well, that's fine. Just don't expect us to be very helpful, because we're stumped until you give us more to go on. It's your project. Up to you whether the effort is worth it.

POSTED BY: Eric Rimbey

Hi Eric I apologise my previous email was supposed to be addressing you. I am digesting your reply and i believe in one way you got it right.

Many thanks Adam Cherad

POSTED BY: Adam Cherad

Hello Michael, Thanks for your reply. I am afraid i don't understand at all where you are coming from when you say i quote " it would really be much easier if you showed us a picture or gave us the code that almost works so we don't have to keep guessing at how to interpret your words"

A picture of what? which code? I have nothing of the sort.

I have only my data which i managed to set into nested lists as i have explained, and the sample you chose is good one, notably, {{{2, 3}}, {{4, 5}, {6, 7}, {9, 8}}, {{{8, 4}, {6, 9}}, {{3, 5}, {5, 2}, {7, 8}}}}, this is it! my data is structured in exactly the same way, please consider all single pairs as a nested list as well as i just did to the first one {{2,3}}. My list nl just carries on along the same structure, namely, single pair, 2 pairs, 3 pairs...for over 100 lists. I can't be clearer than this. I have nothing else no picture no code. As i admitted i am a beginner with Mathematica and i was happy having so far been able to set my data into a nested list like i did. Again, all i want is to be able to plot about 15 (+/-5 depending on the requirement but this should not be relevant to you) of my nested lists as separate sets of bar charts (each nested set showing 2 bars of different colors for each pair (which represent a code and a frequency if you must know) it contains either 1 pair,2 pairs, or 3 pairs)) next to each other in a row. From your feedback, i am guessing you are complicating the issue by thinking too much.

Moreover, i am altogether surprised when you say "You can berate us or you can give us what we're asking for so that you can get your problem solved" How can i berate you when i am trying to learn from you. And how can i be holding something to stop you from helping me? You are wrong here,

Anyway, i thank you again and trust with the above clarification, you would catch my drift .

Sincerely, Adam Cherad

POSTED BY: Adam Cherad
Posted 11 months ago

I think I'm starting to understand, but again, it would really be much easier if you showed us a picture or gave us the code that almost works so we don't have to keep guessing at how to interpret your words. I know you think you're being clear and that you're amazed that we don't understand, but that's just how it is: we don't understand. You can berate us or you can give us what we're asking for so that you can get your problem solved.

Anyway, what I think I now understand is that you have two problems. You need to "flatten" a data structure in a particular way so that it can be input into BarChart, and you need to put several bar charts into a row. The latter problem is trivial: just use Map along with whatever row/grid structure you want. The first problem is ambiguous, because you haven't given us enough information. Let me demonstrate explicitly.

Here's the sample data you gave us:

nl = {{2, 3}, {{4, 5}, {6, 7}, {9, 8}}, {{{8, 4}, {6, 9}}, {{3, 5}, {5, 2}, {7, 8}}}};

There are two ways to "flatten" this so that each element of nl can be a bar chart:

nl1 = {{2, 3}, {{4, 5}, {6, 7}, {9, 8}}, {{8, 4}, {6, 9}}, {{3, 5}, {5, 2}, {7, 8}}};
nl2 = {{2, 3}, {{4, 5}, {6, 7}, {9, 8}}, {{8, 4}, {6, 9}, {3, 5}, {5, 2}, {7, 8}}};

Which is the one you want?

As for the second problem, I'll assume you want GraphicsRow:

GraphicsRow[BarChart /@ nl1]

enter image description here

Both BarChart and GraphicsRow have options that you can play with to get the display just the way you want. As it stands, the tick labels are obscured, but you can fix that. Or use plain Row instead. Or you can add a layer of List and use Grid or GraphicsGrid.

Grid[{BarChart /@ nl1}]

enter image description here

POSTED BY: Eric Rimbey

Hi MiChael,
I just looked closer at the bar charts you produced but you seem to have considered only the 2nd number of the pair. I apologize for the confusion; it is clear i am a beginner learning Mathematica, and obviously, my vision is still warped with articulating the critical pivots for an experienced programmer. Anyway, in case you are still interested at wasting few more moments of your time, i clarify as follows:
You took the sample
nl = {{2, 3}, {{4, 5}, {6, 7}, {9, 8}}, {{{8, 4}, {6, 9}}, {{3, 5}, {5, 2}, {7, 8}}}}; and for this sample what i expected were (ignoring the first list {2,3} which i will nest later),
1) One bar chart set for {{4, 5}, {6, 7}, {9, 8}} with 3 pairs of bars (4-5), (6-7), and (9-8) (call it set1 as a legend), meaning each one of the numbers in the pair should be reflected by a bar.
2) and next to it another Bar chart for {{8, 4}, {6, 9}}, with 2 pairs of bars (8-4) and (6-9) (call it set2) and
3) then another for {{3, 5}, {5, 2}, {7, 8}} with 3 pairs of bars (3-5), (5-2), (7-8) call i t set 3) I hope it is clearer
Adam Cherad

POSTED BY: Adam Cherad

Thank you again, Michael,
You were not shooting in the dark, that's about all i need, and i thought my asking for exactly that was explicit. Setting up legends was never a problem, i did mention it earlier just to indicate that each set of bar charts would have its own name (and i know how to do that). Very grateful,
Cheers,
Adam

POSTED BY: Adam Cherad

Nope, still don't get it. I need an example nl. I, too, am truly taken aback by how difficult it is to provide a small working example. The bar charts you show in a row lack legends, even though I explicitly asked about them.

Here's another shot in the dark, probably still wrong:

nl = {{2, 3}, {{4, 5}, {6, 7}, {9, 8}}, {{{8, 4}, {6, 9}}, {{3, 5}, {5, 2}, {7, 8}}}};
GraphicsRow@
 Cases[nl, 
  data_?MatrixQ :> 
   BarChart[data[[All, 2]], ChartLegends -> data[[All, 1]]], Infinity]

enter image description here

Please note that {2, 3} is left off. There is "a separate legend for each nest of either 1 pair, 2 pairs or 3 pairs," but {2, 3} is not in a "nest."

I guess I should just stop. It's an obvious thing, and I don't see it. I'm probably not helping. Good luck! Someone else will probably show me where I'm confused.

POSTED BY: Michael Rogers

Hi there, I am truly taken aback by how much confusion the set up of my query has caused. All i want is to lay a set of bar charts next to each other on a row. The different barcharts represent lists of different lengths which are nested in the main list {nl}, that is all. It should not matter what the nature of the elements is. Even the nesting level could be an arbitrary (L). I did mention i have over a 100 nested list, but it should not be relevant since the code for doing it for 10 sets of barcharts will work for 15 or 20 (i do not intend to lay all the 100 lists in one row) example Thank you Michael so much in any case for taking the time.

POSTED BY: Adam Cherad

By opening my post with "my interpretation," I meant to imply I wasn't confident I understood what was desired. I'm still not. My suggestion at the end of my post is "to give a simple example of nl...and show exactly what you want the arguments of BarChart to become." Maybe drawing what you want would be easier, if you don't know how to do it with BarChart.

Have you seen GraphicsRow[]? It's a way to arrange several bar charts in a row. And some people just use Row[], which is a way to arrange any expressions in a row.

In your example in the OP, {a,b} is a pair at level 1; {c, d} is on level 2, apparently (again, I'm interpreting) to be grouped with the following two pairs; at the end we get {h, j} at level 1 but not, I suppose, to be group with {a, b}, even though both are at the same level. I don't know if there are pairs at deeper levels. You mention hundreds of nested lists, and the lack of a consistent structure leads me to imagine arbitrary levels of nesting. Further I cannot imagine putting hundreds of bar charts in a row and have it be legible. I'm just confused.

Without an example, I do not think I can help further.

POSTED BY: Michael Rogers

Hello Eric "Does that mean you just want multiple BarCharts but arranged more elegantly?" Yes, but it is not for elegance, i need to see the multiple Barchart in one row for other purposes, Thanking you.

POSTED BY: Adam Cherad

Hello Eric
"Does that mean you just want multiple BarCharts but arranged more elegantly?" Yes, but it is not for elegance, i need to see the multiple Barchart in one row for other purposes,
Thanking you.

POSTED BY: Adam Cherad
Posted 11 months ago

I'm struggling to understand what you want.

All the pairs are made up of a code (integer) and a counter, or a frequency

Does that mean that you actually need to do a multiplication on each pair before displaying the chart?

I like the barchart to show them next to each other in a row, but with a separate legend for each

Does that mean you just want multiple BarCharts but arranged more elegantly?

How can i BarChart all the nested lists of the pair of elements, of nl including the deeper levels in one row?

Are you sure you even want BarChart? What you describe here doesn't sound like a bar chart to me. Have you tried the other chart functions?

it only works when I set a loop, like For i to n, barchart each element (i) of the list

Maybe you should provide this loop code so we can at least see an approximation of what you want. Show us the resulting picture and tell us how it differs from what you want.

POSTED BY: Eric Rimbey

Hello Michael,
Many thanks for your time.
The problem with Level 2, is that it opens up all the nested lists into individual pairs, that defeats the issue because Iike the nested pairs to be shown in the barchart as a group.
Put simply, I have nested lists of
1 pair of elements {{a,b}},
2 pairs {{a,e},{b,a}} and
3 pairs {{a,c}, {b,d}, {e,a}}
All elements are integer numbers (All the pairs are made up of a code (integer) and a counter, or a frequency (also an integer).
I like the barchart to show them next to each other in a row, but with a separate legend for each nest of either 1 pair, 2 pairs or 3 pairs.
Thank you again

POSTED BY: Adam Cherad

Here's my interpretation of what you describe:

nl = {{2, 3}, {{4, 5}, {6, 7}, {9, 8}}, {{8, 9}, {6, 9}}};
With[{flat = Level[nl, {-2}]},
 BarChart[flat, ChartLegends -> {flat, None}, 
  ChartStyle -> {Automatic, None}]
 ]

Bar chart of data

An alternative code for flat is flat = Cases[nl, {__?NumericQ}, Infinity]. Then it would work if the data contained numeric expressions Pi or Sqrt[2], instead of just explicit numbers.

You might want to give a simple example of nl, as I have done, and show exactly what you want the arguments of BarChart to become. Unless I've accidentally hit the nail on the head, so to speak.

POSTED BY: Michael Rogers
Reply to this discussion
Community posts can be styled and formatted using the Markdown syntax.
Reply Preview
Attachments
Remove
or Discard