I have read the relevant documentation. It is known that ListLinePlot can control the line's color through x-axis or y-axis data. However, I need to control the line's color based on additional data. Sample data or code is as follows:
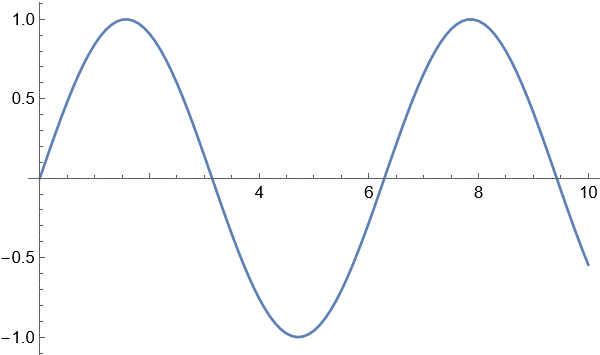
data = Table[{x, Sin[x], Cos[x]}, {x, 0, 10, 0.1}];
ListLinePlot[data[[All, {1, 2}]]]
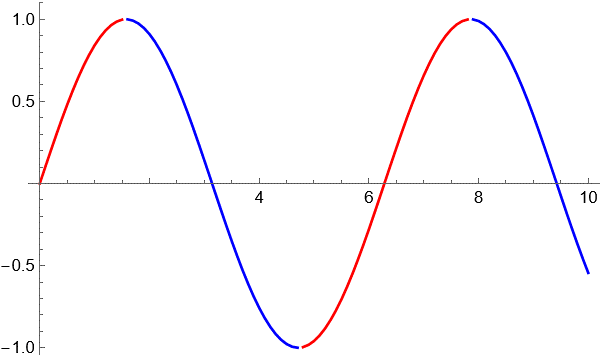
I hope to control the color of the line segment based on data[[All,3]]. For example, when the value is greater than or equal to 0, it is red; when it is less than 0, it is green. How to do this?
I tried another way, but I couldn't reconnect the line.
Show[Map[
  ListLinePlot[#[[All, {1, 2}]],
      PlotStyle -> If[#[[1, 3]] >= 0, Red, Blue]] &@# &,
  SplitBy[data, #[[3]] >= 0 &]], PlotRange -> All]