Message Boards Message Boards

Isovariance Curves / Markowitz Portfolio Selection

Posted 10 years ago

I'm trying to replicate the isovariance curves from Markowitz (1952).

The equation which forms these curves is given by the Footnote no. 8.

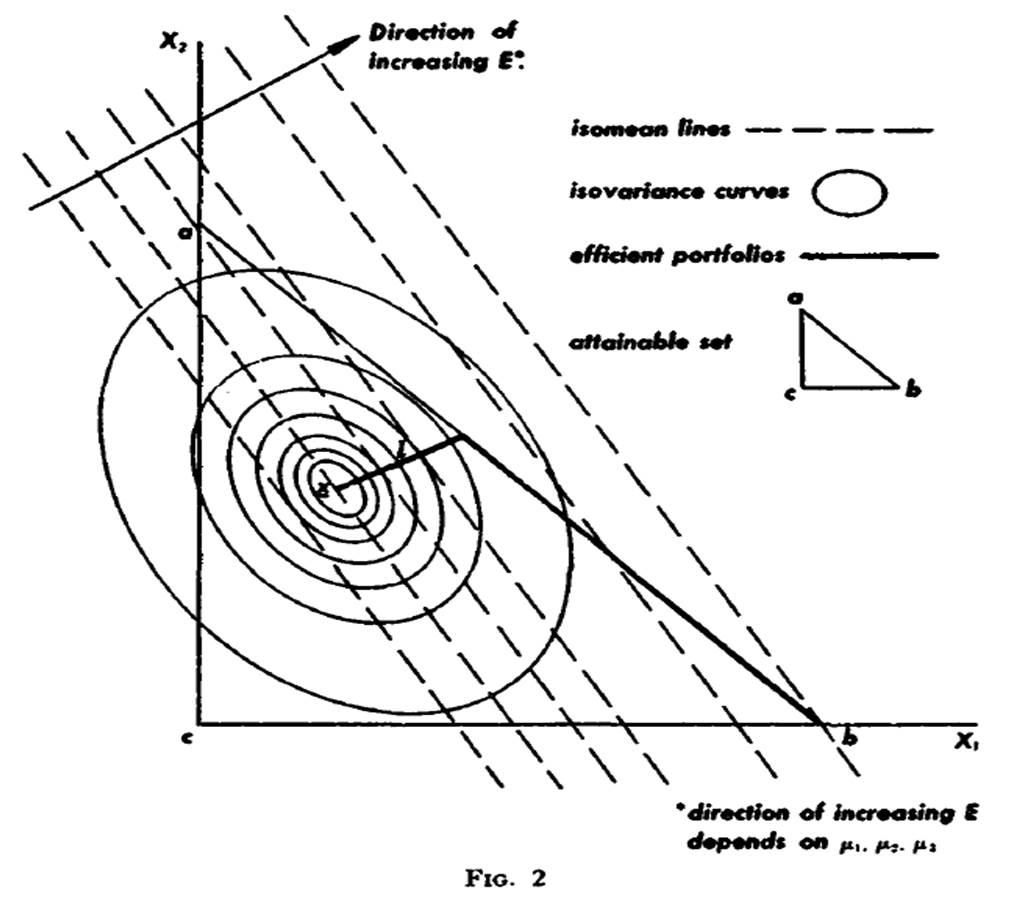
Markowitz claims that they take an ellipsoidal form as shown in the picture below:

enter image description here

However I don't manage to make them look as such.

Anyone willing to have a look?

Attachments:
POSTED BY: Sandu Ursu
2 Replies

The attached notebook should give you an idea of how to do this computation in Mathematica. It does not follow the Markowitz notation religiously, but it is "better" Mathematica style. I believe the isovariance contours will be ellipsoid if there is a negative correlation between at least two of the stocks. Also this link might help you.

Attachments:
POSTED BY: Seth Chandler
Posted 10 years ago

Thank you, Seth! That's very useful!

POSTED BY: Sandu Ursu
Reply to this discussion
Community posts can be styled and formatted using the Markdown syntax.
Reply Preview
Attachments
Remove
or Discard

Group Abstract Group Abstract