Message Boards Message Boards

Aggregate `EventSeries` data by day?

Posted 1 month ago

I'm thinking myself stupid but I cannot grasp how the GroupBy function works, so...

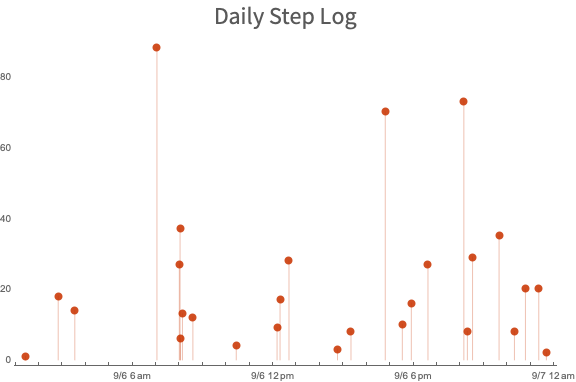
I have a Databin which consists of timestamped step values (timestamp using the Data Drop's built-in Timestamp, and then a numeric value for number of steps recorded), captured by my Apple Watch.

I can plot this data as-is, easily enough:

Daily Step Log

But now I want to see a bigger picture, with the total number of steps by day. For the life of me I can't figure out how GroupBy is supposed to do this to the point that I'm about ready to switch to something else (like InfluxDB and Python/Pandas, the former of which is designed specifically for time-series data).

POSTED BY: Steven Buehler

Maybe this is helpful:

  1. Generate some random test data (100 data points for the last 10 days):

    data = Table[{RandomDate[Quantity[-10, "Days"]], RandomInteger[100]}, 100]
    
  2. You can make a plot to see how it compares to your data (which I don't have access to):

    DateListPlot[data, Joined -> False, Filling -> Axis]
    
  3. Use GroupBy to group by day and then total the results:

    GroupBy[data, DateObject[First[#], "Day"] &, Total[#[[All, 2]]] &]
    

The second argument of GroupBy groups the data by day (it sets the granularity of the date objects to "Day" so it throws away the hours, minutes, and seconds). Instead of "Day" granularity you can also use "Month" if you want to group by month.

The third argument of GroupBy computes the totals for the second column.

POSTED BY: Arnoud Buzing
Reply to this discussion
Community posts can be styled and formatted using the Markdown syntax.
Reply Preview
Attachments
Remove
or Discard

Group Abstract Group Abstract