I'm thinking myself stupid but I cannot grasp how the GroupBy function works, so...
I have a Databin which consists of timestamped step values (timestamp using the Data Drop's built-in Timestamp, and then a numeric value for number of steps recorded), captured by my Apple Watch.
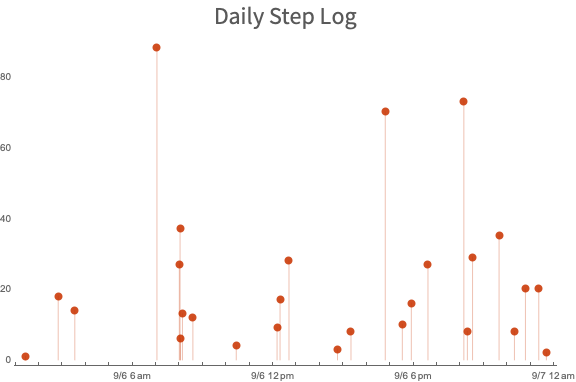
I can plot this data as-is, easily enough:

But now I want to see a bigger picture, with the total number of steps by day. For the life of me I can't figure out how GroupBy is supposed to do this to the point that I'm about ready to switch to something else (like InfluxDB and Python/Pandas, the former of which is designed specifically for time-series data).