Message Boards Message Boards

0
|
331 Views
|
5 Replies
|
3 Total Likes
View groups...
Share
Share this post:

Plot of piecewise function comes out empty

Posted 12 days ago

I need to plot the graph as shown in the picture below. At a math forum, they helped me choose a function for building such a graph. I introduced this feature in Wolfram Mathematica, but I didn't get the graph I needed. Tell me what I did wrong. Thanks

enter image description here

5 Replies

You can assemble the functions on each subdomain using Table function:

m = Range[1, nb - 1];
flatParts = Table[{(nb - d)*a, d (b + c) - c <= t <= d*(b + c)}, {d, m}]
slantParts=Table[{a/b (nb*b+(d-1)*c-t),(d-1)*(b+c)<=t<=d*(b+c)-c},{d,m}]
pw[t_] := Evaluate[Piecewise[flatParts~Join~slantParts]];

Visualization

vBars = Flatten[Table[{(d - 1)*(b + c), d*(b + c) - c}, {d, m}]];
Plot[
 pw[t], {t, 0, 721/2400}, AspectRatio -> 1.2, PlotPoints -> 200, 
    GridLines -> {vBars, flatParts[[All, 1]]}
]
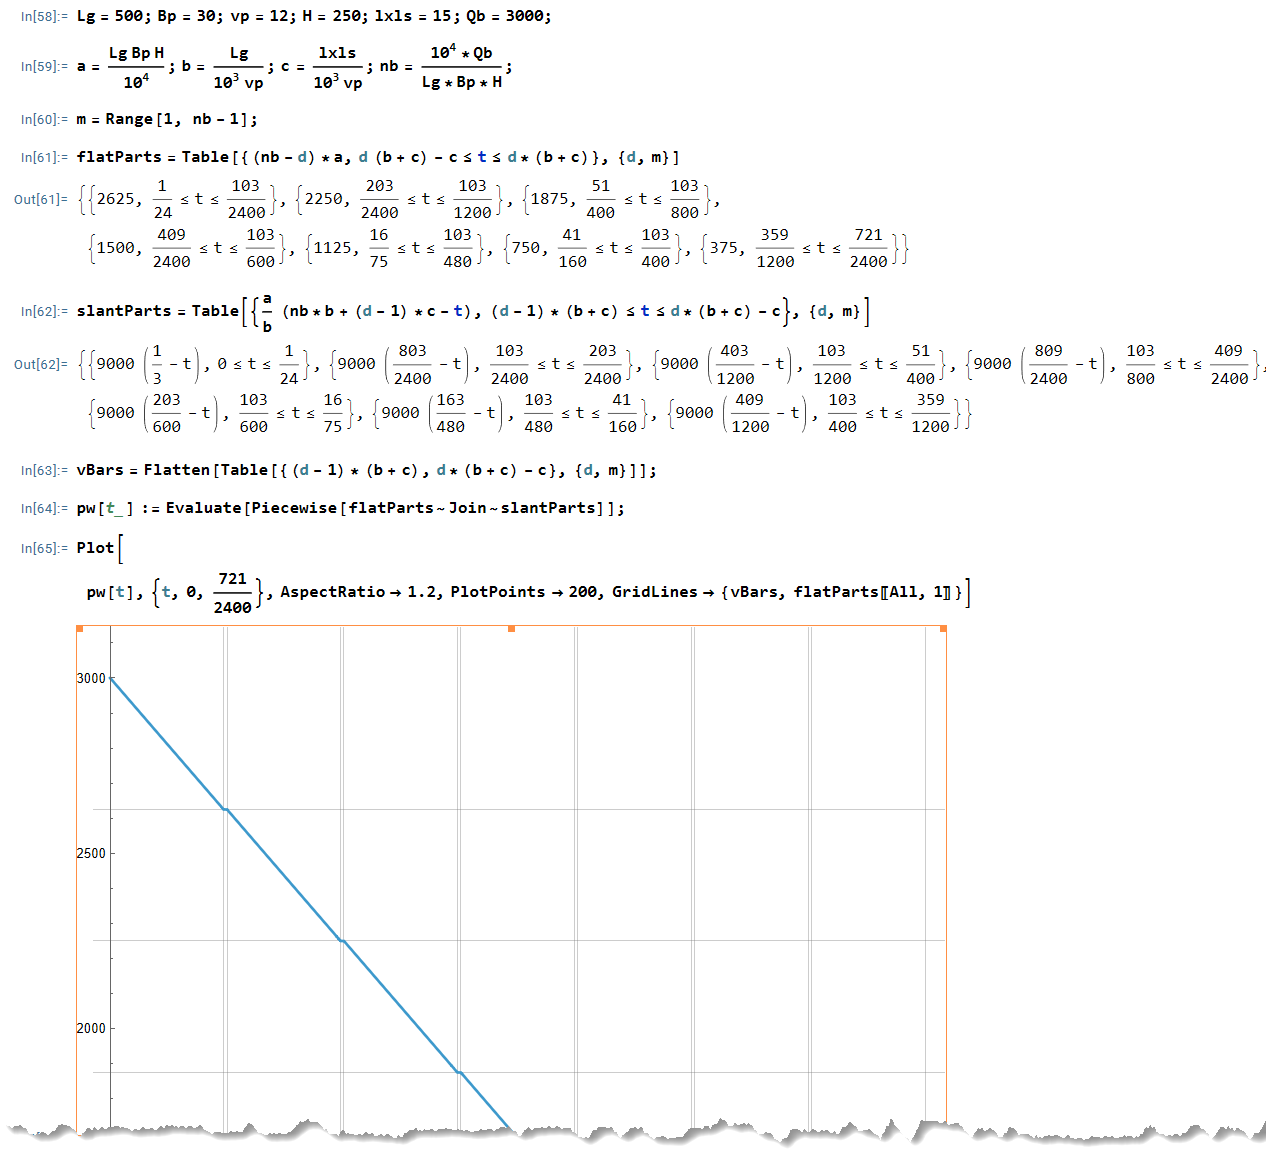
plt

POSTED BY: Shenghui Yang

Just a curiosity on a detail of your code: is the line

pw[t_] := Evaluate[Piecewise[flatParts~Join~slantParts]];

equivalent to

pw[t_] = Piecewise[flatParts~Join~slantParts];

or is there a difference?

POSTED BY: Gianluca Gorni

They are the same here.

POSTED BY: Shenghui Yang

Thanks for the reply. I was trying to enter the expression shown in the picture below. I probably did it wrong. I don't quite know how to do it right.…

enter image description here

The Range[] parts of your definition of Q is the problem. Honestly, I'm not sure what you mean, so I don't know how to fix it. Maybe ...m = Range[1 , nb] is meant to be ... && 1 <= m <= nb. That's a guess based on a possible mistake on your part in understanding what the Range[] function means and does.

POSTED BY: Michael Rogers
Reply to this discussion
Community posts can be styled and formatted using the Markdown syntax.
Reply Preview
Attachments
Remove
or Discard

Group Abstract Group Abstract