You can assemble the functions on each subdomain using Table function:
m = Range[1, nb - 1];
flatParts = Table[{(nb - d)*a, d (b + c) - c <= t <= d*(b + c)}, {d, m}]
slantParts=Table[{a/b (nb*b+(d-1)*c-t),(d-1)*(b+c)<=t<=d*(b+c)-c},{d,m}]
pw[t_] := Evaluate[Piecewise[flatParts~Join~slantParts]];
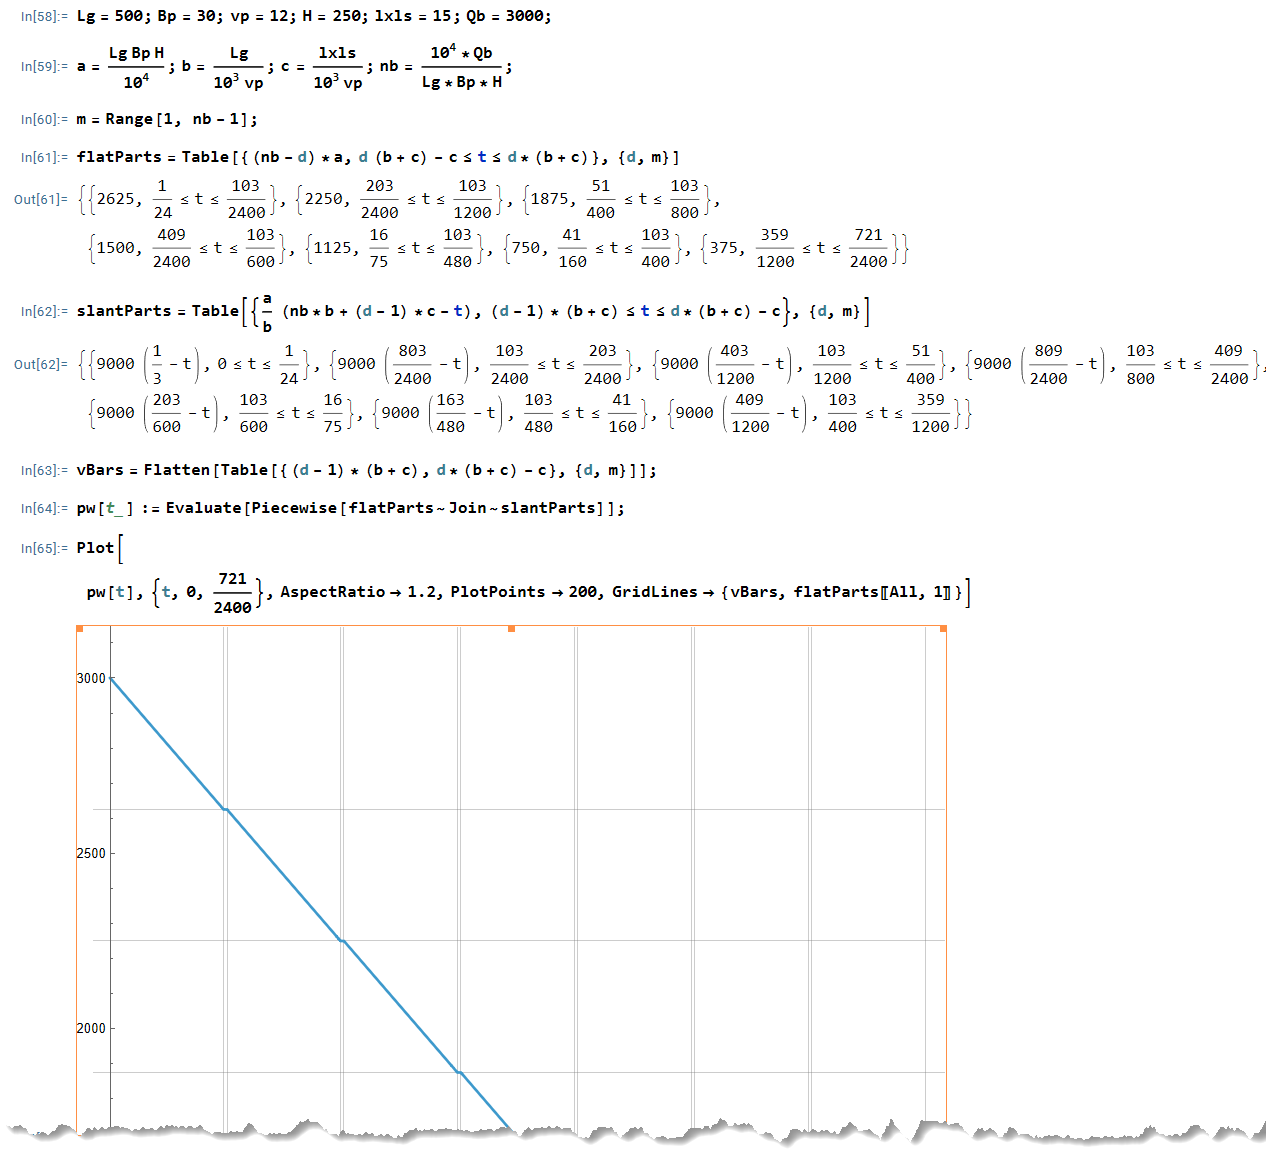
Visualization
vBars = Flatten[Table[{(d - 1)*(b + c), d*(b + c) - c}, {d, m}]];
Plot[
 pw[t], {t, 0, 721/2400}, AspectRatio -> 1.2, PlotPoints -> 200,
    GridLines -> {vBars, flatParts[[All, 1]]}
]