Knowledge of the data generation process is essential to get a good fit AND the "confidence" to trust predictions. You've mentioned limited resolution resulting in a "rolloff effect". That should be included in any modeling.
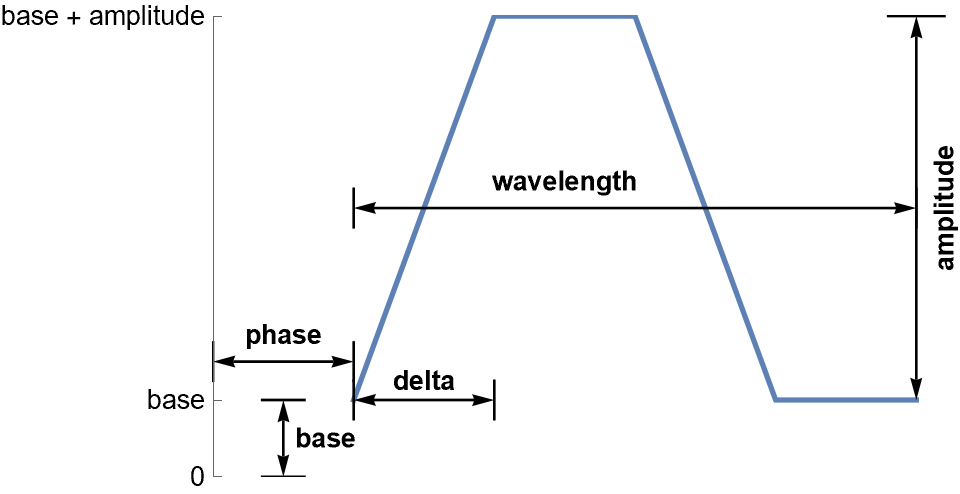
Maybe those issues result in departures from a square wave. So here is another parameterization of a trapezoidal wave. One feature is that one of the parameters (delta) is a measure of departure from a square wave. A delta value of zero results in a square wave. Below is a crude figure showing the parameterization for a single wave:
(* Trapezoidal wave function *)
f[x_?NumericQ, wavelength_?NumericQ, amplitude_?NumericQ,
phase_?NumericQ, base_?NumericQ, delta_?NumericQ] := Module[{s, y},
s = Mod[x - phase, wavelength];
If[s <= delta, y = base + amplitude s/delta,
If[delta < s <= wavelength/2, y = base + amplitude,
If[wavelength/2 < s <= wavelength/2 + delta,
y = base + amplitude (1 - (s - wavelength/2)/delta),
y = base]]];
y
]
data = {{-6.25, 0.00219649}, {-5.75, 0.0291773}, {-5.25, 0.0428364}, {-4.75, 0.0418075},
{-4.25, 0.0390189}, {-3.75, 0.0142977}, {-3.25, 0.000728449}, {-2.75, 0.000577218},
{-2.25, 0.00314383}, {-1.75, 0.0275447}, {-1.25, 0.0428128}, {-0.75, 0.0433703},
{-0.25, 0.0433703}, {0.25, 0.0403935}, {0.75, 0.0160277}, {1.25, 0.000686316},
{1.75, 0.00036222}, {2.25, 0.00288114}, {2.75, 0.0256044}, {3.25, 0.0416728},
{3.75, 0.0429419}, {4.25, 0.0396677}, {4.75, 0.0162309}};
nlm = NonlinearModelFit[data, f[x, wavelength, amplitude, phase, base, delta],
{{wavelength, 4}, {amplitude, 0.04}, {phase, 2}, {base, 0}, {delta, 0.5}}, x];
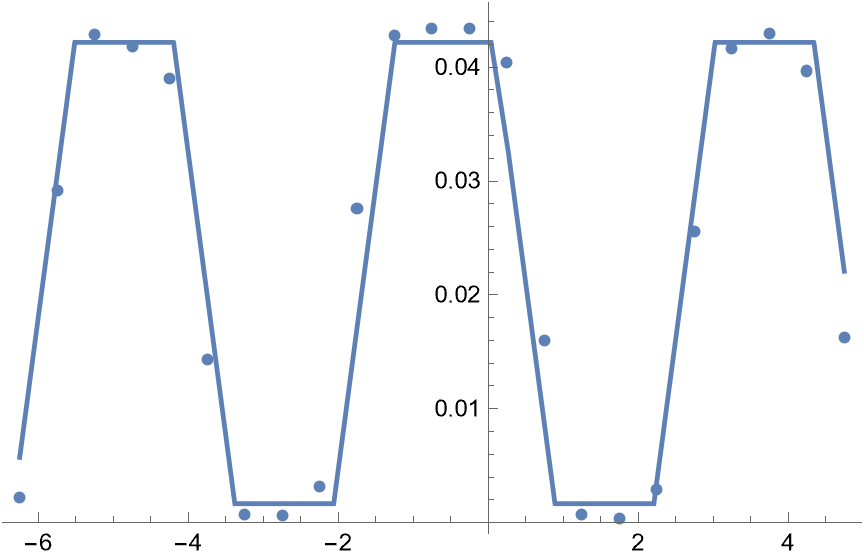
Show[ListPlot[data], Plot[nlm[x], {x, Min[data[[All, 1]]], Max[data[[All, 1]]]}]]
nlm["ParameterTable"]
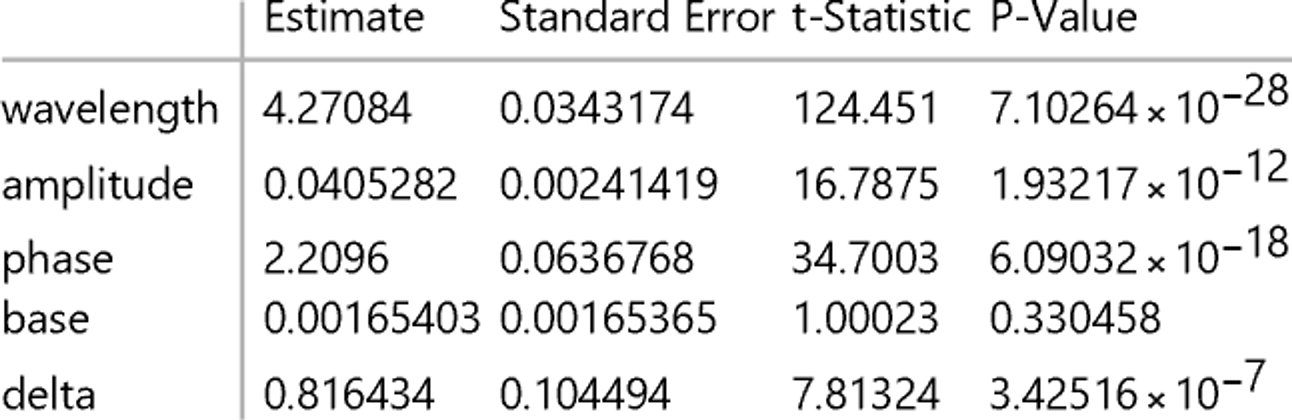
One can see that delta (the parameter characterizing the departure from a square wave) is highly significant (meaning it is significantly different from zero). While the underlying physical process might be a square wave, the measurement process does not result in a square wave and maybe a trapezoidal wave is a better approximation of the results from measurements.
You can compare all of models in the provided answers using nlm["AICc"]. This provides a relative ranking of the models from all of the answers here with the better models having smaller AICc values.


