Group Abstract Group Abstract

Message Boards Message Boards

Fitting data to a square wave

I have a question about the attached MM notebook (just a few lines). I'm trying to fit a lineout through the digital image of a line pair gauge to a square wave. FindFit appears to fit the mean value (b) and at least takes a stab at fitting the amplitude (a); however, it seems to make no attempt to fit the offset on the x axis (x0). Why not? What am I missing?

Also, I would like to get more detail on the fit parameters, in particular, the uncertainties, but I haven't been able to figure out how to get MM to dump that information. How can I do that?

Thanks in advance for any help on this.

Attachments:
POSTED BY: James Hall
19 Replies
Posted 7 months ago

Knowledge of the data generation process is essential to get a good fit AND the "confidence" to trust predictions. You've mentioned limited resolution resulting in a "rolloff effect". That should be included in any modeling.

Maybe those issues result in departures from a square wave. So here is another parameterization of a trapezoidal wave. One feature is that one of the parameters (delta) is a measure of departure from a square wave. A delta value of zero results in a square wave. Below is a crude figure showing the parameterization for a single wave:
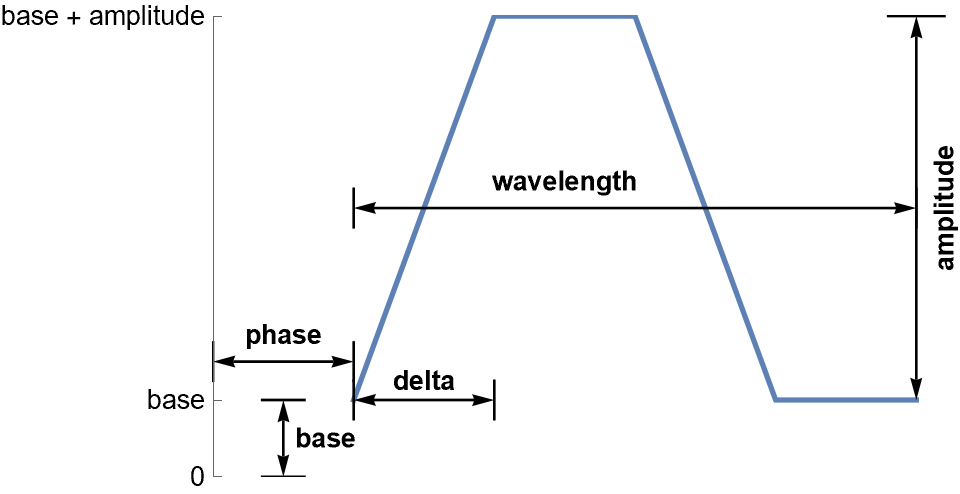
Image of a single wave

(* Trapezoidal wave function *)
f[x_?NumericQ, wavelength_?NumericQ, amplitude_?NumericQ, 
  phase_?NumericQ, base_?NumericQ, delta_?NumericQ] := Module[{s, y},
  s = Mod[x - phase, wavelength];
  If[s <= delta, y = base + amplitude s/delta,
   If[delta < s <= wavelength/2, y = base + amplitude,
    If[wavelength/2 < s <= wavelength/2 + delta, 
     y = base + amplitude (1 - (s - wavelength/2)/delta),
     y = base]]];
  y
  ]

data = {{-6.25, 0.00219649}, {-5.75, 0.0291773}, {-5.25, 0.0428364}, {-4.75, 0.0418075},
   {-4.25, 0.0390189}, {-3.75, 0.0142977}, {-3.25, 0.000728449}, {-2.75, 0.000577218},
   {-2.25, 0.00314383}, {-1.75, 0.0275447}, {-1.25, 0.0428128}, {-0.75, 0.0433703},
   {-0.25, 0.0433703}, {0.25, 0.0403935}, {0.75, 0.0160277}, {1.25, 0.000686316},
   {1.75, 0.00036222}, {2.25, 0.00288114}, {2.75, 0.0256044}, {3.25, 0.0416728},
   {3.75, 0.0429419}, {4.25, 0.0396677}, {4.75, 0.0162309}};

nlm = NonlinearModelFit[data, f[x, wavelength, amplitude, phase, base, delta],
   {{wavelength, 4}, {amplitude, 0.04}, {phase, 2}, {base, 0}, {delta, 0.5}}, x];

Show[ListPlot[data], Plot[nlm[x], {x, Min[data[[All, 1]]], Max[data[[All, 1]]]}]]
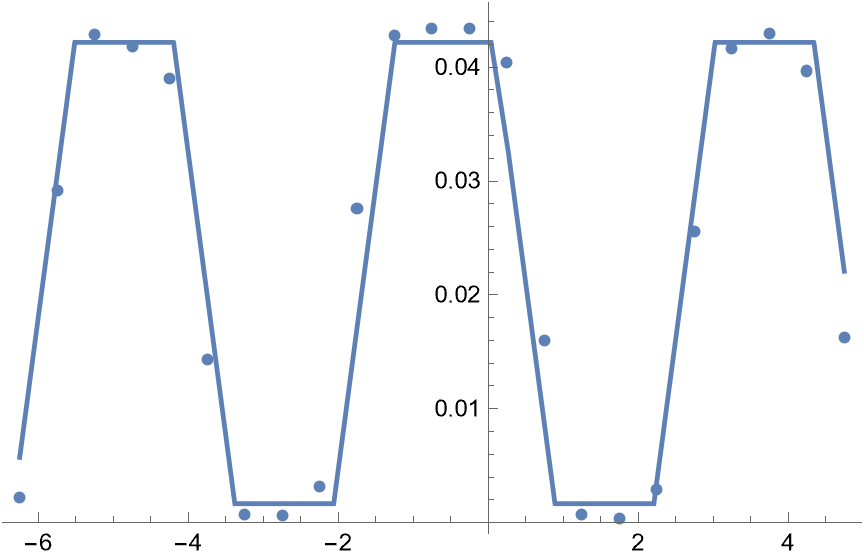
data and fit

nlm["ParameterTable"]

parameter table

One can see that delta (the parameter characterizing the departure from a square wave) is highly significant (meaning it is significantly different from zero). While the underlying physical process might be a square wave, the measurement process does not result in a square wave and maybe a trapezoidal wave is a better approximation of the results from measurements.

You can compare all of models in the provided answers using nlm["AICc"]. This provides a relative ranking of the models from all of the answers here with the better models having smaller AICc values.

POSTED BY: Jim Baldwin
Posted 7 months ago

Thanks for such a detailed response, Jim. I'll give this a try.

POSTED BY: Jamesa Hall

Maybe:

POSTED BY: Mariusz Iwaniuk
Posted 7 months ago

Hi Mariusz,

I've played around with your suggested fit function and it seems to work pretty well in my application; however, I can't quite figure out how to use the fit parameters to derive the max and min of the curve. I need to know how to do that in order to use the standard errors in the parameters to determine the uncertainty the gauge modulation (mod = ((max-min)/(max+min)). Can you give me any insight as to how to do that? If so, please let me know.

Thanks much,

Jim

POSTED BY: Updating Name
Posted 7 months ago

Hi Jim, I'll take the liberty of answering for Marius.

His very useful model is

a Tanh[r Sin[k (x - x0)]]+b

Assuming a and r are chosen not negative. By inspection, it is at a maxima when the Sin function is at +1, where it has a value of

b + a Tanh[r]

and a minima where the Sin function is at -1, where it has a value of

b - a Tanh[r]

Just for fun, I did this by the usual method of derivatives. I attach the notebook.

Attachments:
POSTED BY: David Keith

It could be natural to use Haar wavelets... But the fit is not very good.

Attachments:
POSTED BY: Claude Mante
Posted 7 months ago

Given my previous comments, I wonder if your data was generated by a trapezoidal wave rather than a square wave.

data={{-6.25, 0.00219649}, {-5.75, 0.0291773}, {-5.25, 0.0428364}, {-4.75, 0.0418075}, 
  {-4.25, 0.0390189}, {-3.75, 0.0142977}, {-3.25, 0.000728449}, {-2.75, 0.000577218}, 
  {-2.25, 0.00314383}, {-1.75, 0.0275447}, {-1.25, 0.0428128}, {-0.75, 0.0433703}, 
  {-0.25, 0.0433703}, {0.25, 0.0403935}, {0.75, 0.0160277}, {1.25, 0.000686316}, 
  {1.75, 0.00036222}, {2.25, 0.00288114}, {2.75, 0.0256044}, {3.25, 0.0416728}, 
  {3.75, 0.0429419}, {4.25, 0.0396677}, {4.75, 0.0162309}};

nlm = NonlinearModelFit[data,
   (a/\[Pi])*(ArcSin[Sin[(\[Pi]/m) x + l]] + ArcCos[Cos[(\[Pi]/m) x + l]]) - a/2 + c,
   {{a, 0.04}, {m, 2}, {l, 3}, {c, 0.02}}, x];
Show[ListPlot[data], Plot[nlm[x], {x, Min[data[[All, 1]]], Max[data[[All, 1]]]}]]

Trapezoidal wave fit

The equation was lifted from Amrtanshu Raj 's answer at https://uk.mathworks.com/matlabcentral/answers/684163-generating-periodic-trapezoidal-waves-with-ramps. (Yes, a MATLAB site.)

POSTED BY: Jim Baldwin
Posted 7 months ago

This looks very promising! Thanks much! I'll give it a try.

POSTED BY: Jamesa Hall
Posted 7 months ago

I'm curious as to how you created the simulated data. I ask because if you sampled a square wave from $x=-6.3$ to $x=4.8$ with a constant error variance over a cycles of a square wave, it would seem near impossible to get any of those 6 points in the middle of the figure (i.e., those points between $y=0.01$ and $y=0.03$).

In other words, those 6 points could be considered outliers and maybe given very little weight.

POSTED BY: Jim Baldwin
Posted 7 months ago

The data file is a scan through the simulated digital image of a rectangular line pair gauge. The detector has limited resolution, which is why the maxima show rolloff effects.

POSTED BY: Jamesa Hall
Posted 7 months ago

I believe you that the "maxima show rolloff effects." But what does that mean? I don't speak that language. Might there be a need to include that "effect" in the modeling?

POSTED BY: Jim Baldwin
Posted 7 months ago

Frankly I would find the phase separately by brute force, using reasonable candidate values (timesinbetween below). SqWave is just a pathologically nasty function to fit automatically. I would also, probably, rewrite SqWave in some other form (like SquareWave?), but here the method below doesn't really care about that:

POSTED BY: Jari Kirma
Posted 7 months ago

Hi James,

In the attached notebook, I first fit the data to a sine function, and then use the determined parameters as estimates for fitting to the square wave. I used NonlinearModelFit, which provides statistics on the fit.

Attachments:
POSTED BY: David Keith
Posted 7 months ago

Thanks, David. Using a Sin fit looks like a good way to define x0 and estimate starting values for a & b. There are several other techniques you included that I can make use of. I'm puzzled that the amplitude (a) turns out to be negative (not sure what that means), and I'm a bit surprised/disappointed that the fit value doesn't match the approximate max & min values of the data better than it does, because I would like to use this technique to estimate the gauge modulation ((max-min)/(max+min)).

Again, thanks much for your help - I really appreciate it.

POSTED BY: Jamesa Hall
Posted 7 months ago
POSTED BY: David Keith
Posted 7 months ago

Quite so, David, and a subjective data analysis was precisely what I was hoping to avoid by doing this fit. Thanks again. - Jim

POSTED BY: Jamesa Hall
Posted 7 months ago

Hi Jamesa, The attached notebook takes a perhaps too naïve approach. It does select data to be processed. It estimates the peaks using data with y values greater then 80% of the max, and the valleys using values less than 20% of the max.

enter image description here

Attachments:
POSTED BY: David Keith

NonlinearModelFit works better for this:

enter image description here

POSTED BY: Anton Antonov
Posted 7 months ago

Thanks for your input, Anton. I appreciate your help. Did this actually use x0 as a fit parameter? It look like it just set the value to 1.000... with 0 uncertainty.

POSTED BY: Jamesa Hall
Reply to this discussion
Community posts can be styled and formatted using the Markdown syntax.
Reply Preview
Attachments
Remove
or Discard