Can you given an example of what you don't think you can get with the {xmin, xmax, dx} option? That option (in my limited imagination) would seem to cover all possibilities that one might want (at least with a constant binwidth).
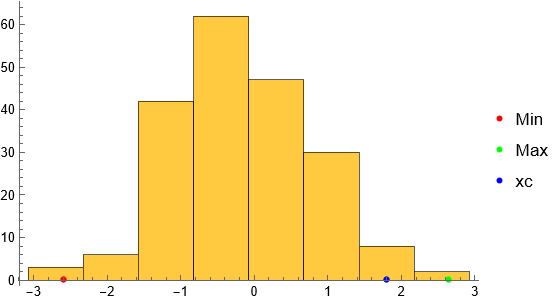
For example, suppose for a dataset x (continuous or discrete) you want a specific binwidth dx and you want one of the bins to be centered at xc.
SeedRandom[12345];
x = RandomVariate[NormalDistribution[0, 1], 200];
dx = 3/4;  (* Desired binwidth *)
xc = 1.8;    (* One specific bin midpoint *)

{xmin, xmax} = MinMax[x];
xlow = xc - dx/2 - dx Floor[(xc + dx/2 - xmin)/dx];
xhigh = xc + dx/2 + dx Ceiling[(xmax - xc - dx/2)/dx];
Show[Histogram[x, {xlow, xhigh, dx}],
 ListPlot[{{{xmin, 0}}, {{xmax, 0}}, {{xc, 0}}},
  PlotStyle -> {Red, Green, Blue}, PlotLegends -> {"Min", "Max", "xc"}]]

The example I've given is very general and certainly most folks would opt for "nice" values for xc and dx with likely xc being a multiple of dx. But if you also only want tick marks at the center of the bins, then you'll likely need to specify the tick marks as in Eric Rimbey's answer.
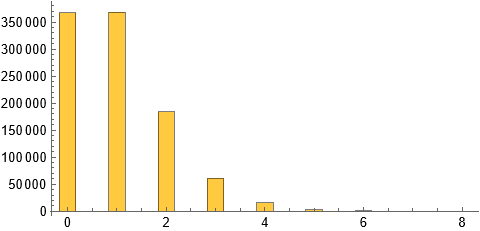
Addition: From your responses and examples I'm guessing that you have data that takes on non-negative integer values and want to produce histogram bars that don't touch and you want to be in control of the width of the bars and you want the horizontal axis labels to be centered under the bars. That can be done (almost) automatically with the code I produced above. The limitations are that you need to specify the binwidth as a ratio of the form 1/2, 1/3, 1/4, 1/5, etc.
(* Generate data *)
SeedRandom[12345];
poisson = RandomVariate[PoissonDistribution[1], 1000000];

dx = 1/3;  (* Desired binwidth *)

(* Produce histogram *)
{xmin, xmax} = MinMax[poisson];
xc = poisson[[1]];  (* Choose any value in the dataset *)
xlow = xc - dx/2 - dx Floor[(xc + dx/2 - xmin)/dx];
xhigh = xc + dx/2 + dx Ceiling[(xmax - xc - dx/2)/dx];
Histogram[poisson, {xlow, xhigh, dx}]
