Message Boards Message Boards

Center histogram bins on ticks

Is there are straightforward way to center Histogram[] bins over tick marks while still specifying bin width?

Histogram documentation says bins are automatically centered for discrete values. That's not my experience. I could solve that problem by explicitly specifying bins that straddle tick marks, but I don't know how to combine that with a bin-width specification.

Histogram[
 poisson = RandomVariate[PoissonDistribution[1], 1000000], {1/2}]
POSTED BY: Jay Gourley
7 Replies
Posted 6 days ago

If something looks like a Graphics display, it very well might be, and if you look at the FullForm of your histogram, you'll see that the output is indeed a Graphics "object". That suggests that Histogram will accept the same options that Graphics does. There might be overrides or other imperfect matches, but basically you can expect to have the same control over the output that you would for Graphics. And the documentation for Histogram says this explicitly:

Histogram has the same options as Graphics with the following additions and changes: ...

One option that Graphics accepts is Ticks, and if I'm understanding your question, that's the relevant one for you. Look up the documentation for Ticks to get the specifics, but here's an example:

With[
 {poisson = RandomVariate[PoissonDistribution[1], 100]},
 Histogram[poisson, {1/2}, Ticks -> {Range[Min[poisson] + 1/4, Max[poisson] + 1/4, 1], Automatic}]]

enter image description here

POSTED BY: Eric Rimbey
Posted 6 days ago

How about

Histogram[poisson = RandomVariate[PoissonDistribution[1], 1000000], {-1/2, Max[poisson] + 1/2, 1}]

Histogram

POSTED BY: Jim Baldwin

Thanks, Jim Baldwin. That works and it's straightforward. But it doesn't address the difficulty I'm focused on. I can center the bins over the numbers the way you showed. Or I can set the bin-width. My problem is that I cannot do both at the same time.

POSTED BY: Jay Gourley
Posted 6 days ago

Can you given an example of what you don't think you can get with the {xmin, xmax, dx} option? That option (in my limited imagination) would seem to cover all possibilities that one might want (at least with a constant binwidth).

For example, suppose for a dataset x (continuous or discrete) you want a specific binwidth dx and you want one of the bins to be centered at xc.

SeedRandom[12345];
x = RandomVariate[NormalDistribution[0, 1], 200];
dx = 3/4;  (* Desired binwidth *)
xc = 1.8;    (* One specific bin midpoint *)

{xmin, xmax} = MinMax[x];
xlow = xc - dx/2 - dx Floor[(xc + dx/2 - xmin)/dx];
xhigh = xc + dx/2 + dx Ceiling[(xmax - xc - dx/2)/dx];
Show[Histogram[x, {xlow, xhigh, dx}],
 ListPlot[{{{xmin, 0}}, {{xmax, 0}}, {{xc, 0}}},
  PlotStyle -> {Red, Green, Blue}, PlotLegends -> {"Min", "Max", "xc"}]]

Histogram with specified binwidth and bin midpoint

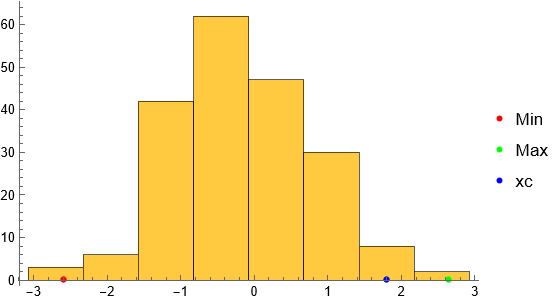
The example I've given is very general and certainly most folks would opt for "nice" values for xc and dx with likely xc being a multiple of dx. But if you also only want tick marks at the center of the bins, then you'll likely need to specify the tick marks as in Eric Rimbey's answer.

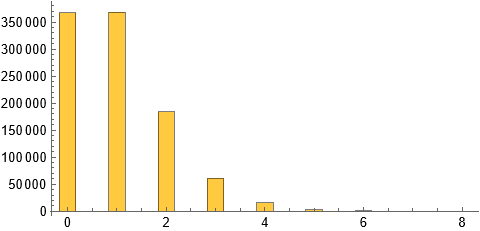
Addition: From your responses and examples I'm guessing that you have data that takes on non-negative integer values and want to produce histogram bars that don't touch and you want to be in control of the width of the bars and you want the horizontal axis labels to be centered under the bars. That can be done (almost) automatically with the code I produced above. The limitations are that you need to specify the binwidth as a ratio of the form 1/2, 1/3, 1/4, 1/5, etc.

(* Generate data *)
SeedRandom[12345];
poisson = RandomVariate[PoissonDistribution[1], 1000000];

dx = 1/3;  (* Desired binwidth *)

(* Produce histogram *)
{xmin, xmax} = MinMax[poisson];
xc = poisson[[1]];  (* Choose any value in the dataset *)
xlow = xc - dx/2 - dx Floor[(xc + dx/2 - xmin)/dx];
xhigh = xc + dx/2 + dx Ceiling[(xmax - xc - dx/2)/dx];
Histogram[poisson, {xlow, xhigh, dx}]

Histogram

POSTED BY: Jim Baldwin

Thanks again, Jim Baldwin, for your commitment to my question. Code below should illustrate my problem. I want to accomplish both proper alignment and separated bars in one histogram. Others must have faced the issue when illustrating discrete sets. I can accomplish this, but not in any straightforward way that would make sense to anyone including to me.

poisson = RandomVariate[PoissonDistribution[1], 500];
Histogram[poisson, {1/4}, 
 PlotLabel -> "Bars Separated. Numbers Misaligned.", 
 AspectRatio -> 1/3]
Histogram[poisson, {-1/2, 6, 1}, 
 PlotLabel -> "Numbers Aligned. Bars Not Separated.", 
 AspectRatio -> 1/3]
POSTED BY: Jay Gourley
Posted 5 days ago

I think there are two issues: (1) How to get done what you want to get done?, and (2) Should you be doing what you want?

To answer the second question one would need to know the purpose for your graphic. For the first part another option is to use the BarChart function:

SeedRandom[12345];
poisson = RandomVariate[PoissonDistribution[1], 500];
BarChart[Last[HistogramList[poisson]], BarSpacing -> 3,
 ChartLabels -> Range[Min[poisson], Max[poisson]]]

Barchart

It finally dawned on me: I think you want the binwidth parameter to be the width of the bar as opposed to a width of a "bin" that might encompass more than one value.

I know these forums are typically "how to do something" rather than "should I do this?" but I think for graphics (and statistical analyses) it's critical to know what is the kind of message to the viewer that's desired. For example, I'm just not seeing the need for separating the bars or even to have bars. Here is a DiscretePlot:

DiscretePlot[Length[poisson] PDF[EmpiricalDistribution[poisson], s],
 {s, 0, Max[poisson]}, AxesOrigin -> {-0.5, 0}]

Discrete plot

POSTED BY: Jim Baldwin

I appreciate your interest. This is an assignment in a physics class on using computers for statistical analysis. This image is part of one problem focusing on the Central Limit Theorem. Its purpose is to illustrate that Poisson is a skewed distribution of non-negative integers. I plan to adopt your idea to use DiscretePlot. That better illustrates the point I want to make.

The problem is part of a much larger assignment. I pulled it out of a draft I'm still working on and published it at Baldwin Conversation . It doesn't include the explanation of shading. Light brown is code. My narrative is light blue. The unshaded portions are from the assignment itself.

I'm the only math major and the only undergraduate in the class. I'm not proficient with Mathematica, and I'm using it under a dispensation from the professor. So I want the images to shine.

POSTED BY: Jay Gourley
Reply to this discussion
Community posts can be styled and formatted using the Markdown syntax.
Reply Preview
Attachments
Remove
or Discard

Group Abstract Group Abstract