Message Boards Message Boards

Reading high resolution weather data from Netatmo

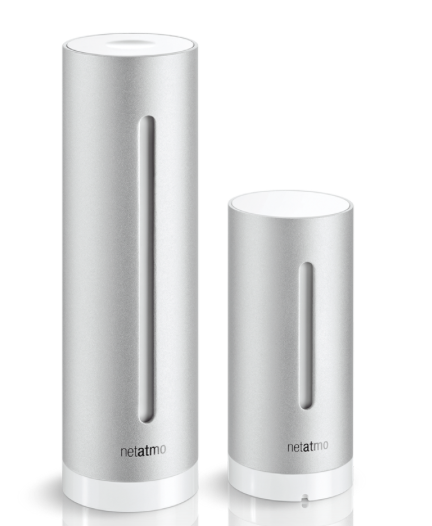
Together with Björn Schelter I have tried to read in data from the personal weather station Netatmo
enter image description here

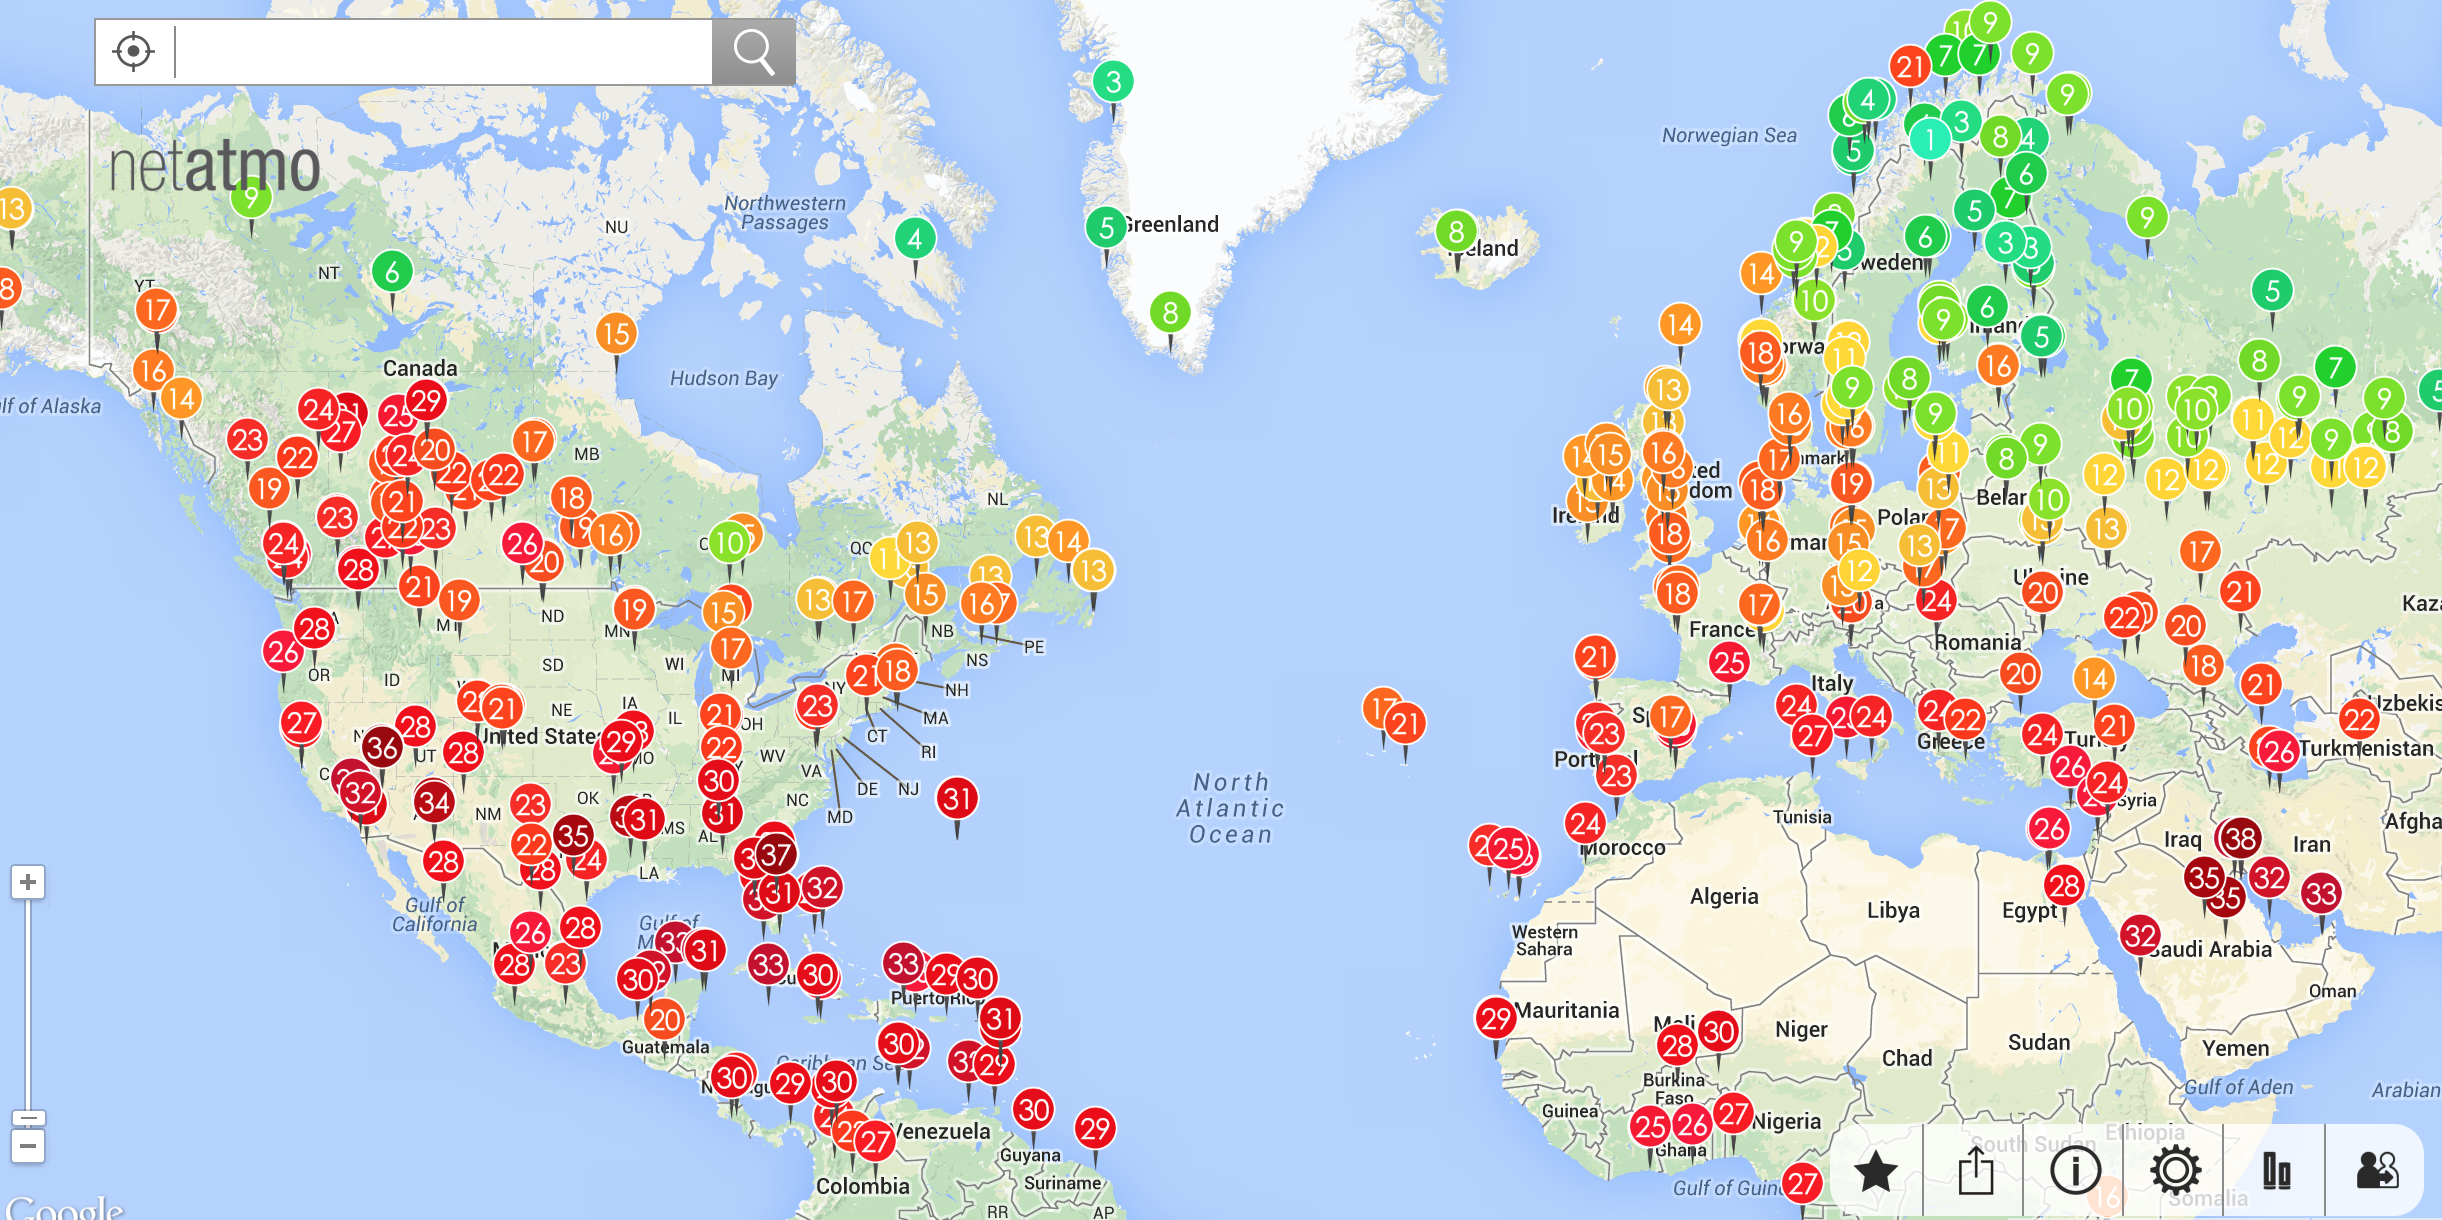
which, as it turns out, is a very good companion for Mathematica; it also features in the connected devices list of Wolfram.This device measures temperature, humidity, pressure, noise level and potentially the precipitation indoors and outdoors. Users are encouraged to share the outdoors data; as the weather station is rather popular there are lots of measurements. On their website https://www.netatmo.com/ the company makes these measurements available. You can represent worldwide data
enter image description here

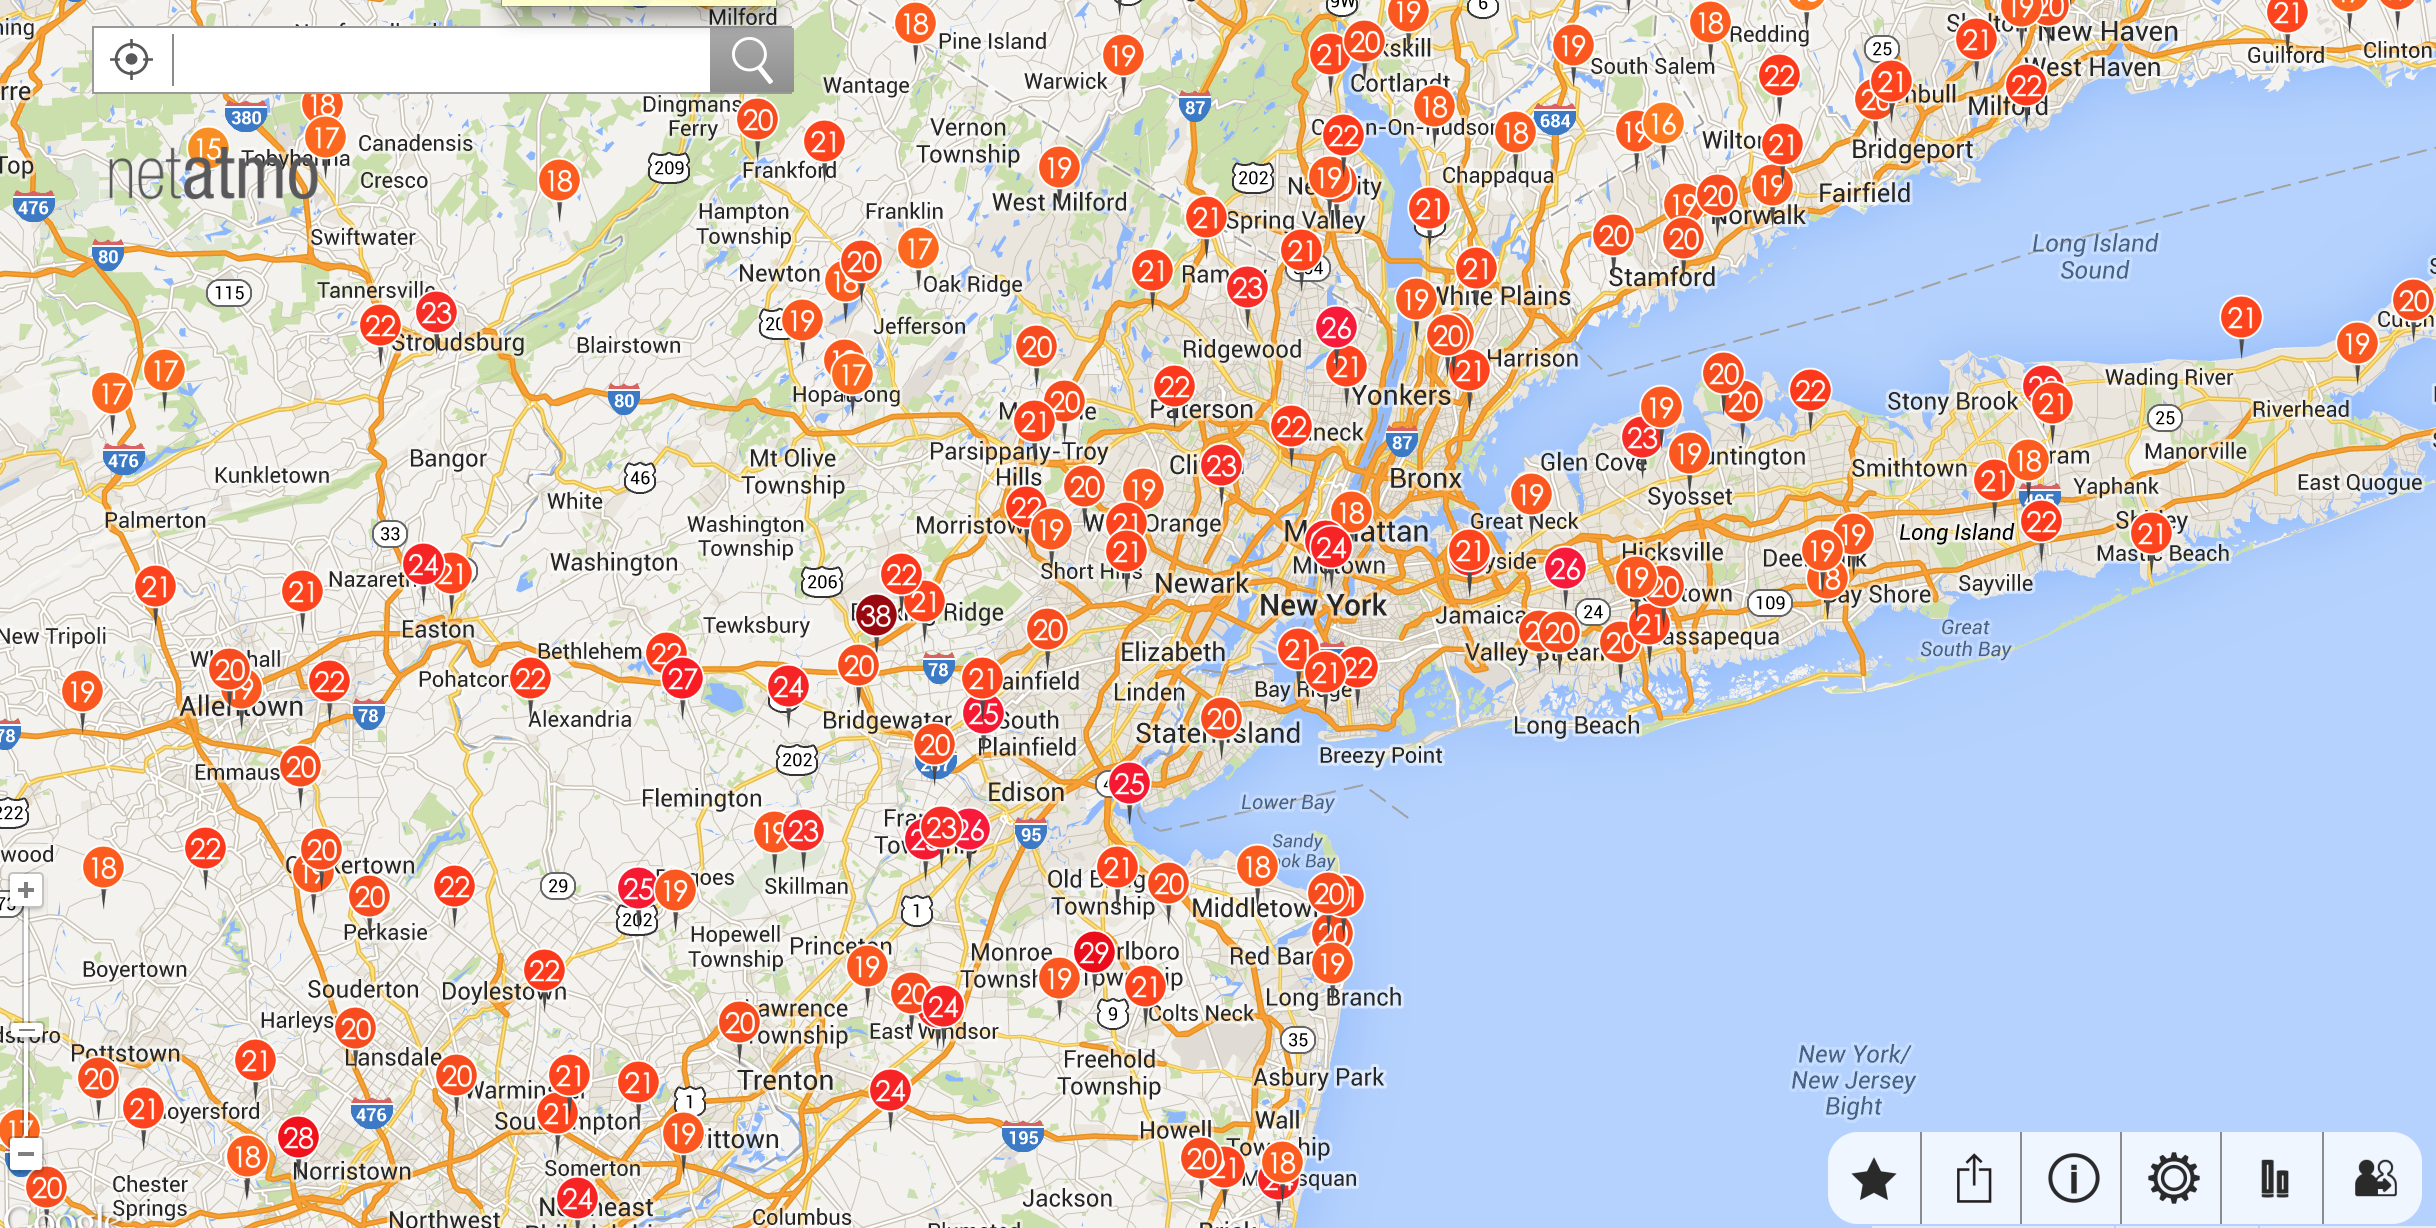
(I know that that figure does not show the entire world!) or zoom in to street level data:
enter image description here

On the website https://dev.netatmo.com you can sign up for a developer account which gives you access to the API of netatmo. In this post I am going to show how to access the data with Mathematica. When you sign up for a netatmo developer account you will be issued a client id and a client secret. These are rather long strings. You will also get a username and a password for your account. Next you need to request an access token, which you can do via the following command:

curl -X POST -d "granttype=password&clientid=AAAAAAAAAAAAAAAAAAAA&client_secret=BBBBBBBBBBBBBBBBBBBBBBBBBBBBBBBBBBBBBBBBBB &username=XXXXXXXXXXXXXXXX&password=YYYYYYYYYYYYYYY&scope=read_station" http://api.netatmo.net/oauth2/token ~/Desktop/request-token.txt

On a Mac I generate a file called netatmo.sh containing that string on the desktop; I obviously substitute AAAAAAAAAAAA by the client id, BBBBBBBBBBBBBBBB by the client secret, XXXXXXXXXXXX and YYYYYYYYYY by the user name and the password. Then I use the terminal command

chmod a+x netatmo.sh

The rest is child's play. We need to execute the command

Run["~/Desktop/netatmo.sh"];
data = Import["https://api.netatmo.net/api/getpublicdata?access_token="<>Last[StringSplit[Import["~/Desktop/request-token.txt", "CSV"][[1, 1]], "\""]] <> 
    "&lat_ne=59.91&lon_ne=13.75&lat_sw=40.42&lon_sw=-20.0&filter=True", "Text"];

Note that the numbers following latne, lonne, latsw, lonsw are the north east and south west latitudes and longitudes. If we want to request data for other regions we can do so by changing these entries. Next we clean the data a little bit:

tab = Quiet[
Select[Select[Table[ToExpression /@ Flatten[StringSplit[#, "]"] & /@ StringSplit[#, "["] & /@ 
If[Length[StringSplit[StringSplit[data, "place"][[k]], ","]] > 12, Drop[StringSplit[StringSplit[data, "place"][[k]],","], {5}], 
StringSplit[StringSplit[data, "place"][[k]], ","]]][[{2, 3, 7, 8, 15}]], {k, 2, Length[StringSplit[data, "place"]]}], Length[Cases[Flatten[#], $Failed]] == 0 &  ], Length[#] == 5 &]];

That does look a bit cryptic but gives us what we want.

tab[[1]]

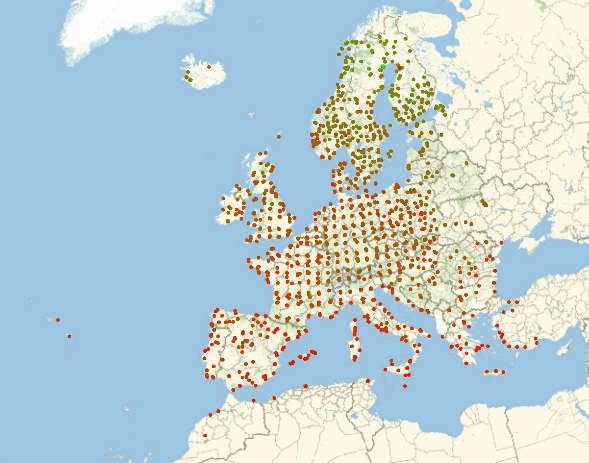
gives {10.5673, 59.8929, 13, 80, 1032.9}, wich are the gps coordinates, the temperature in Celsius, the humidity in % and the pressure in mbar. I will now propose three different representations of the data.

scaled = Rescale[tab[[All, 3]]]; 
GeoGraphics[Table[{GeoStyling[Opacity[0.99], RGBColor[scaled[[k]], 1 - scaled[[k]], 0]], GeoDisk[{tab[[k, 2]], tab[[k, 1]]}, Quantity[20, "Kilometers"] ]}, {k,1, Length[tab]}]]

which gives:
enter image description here

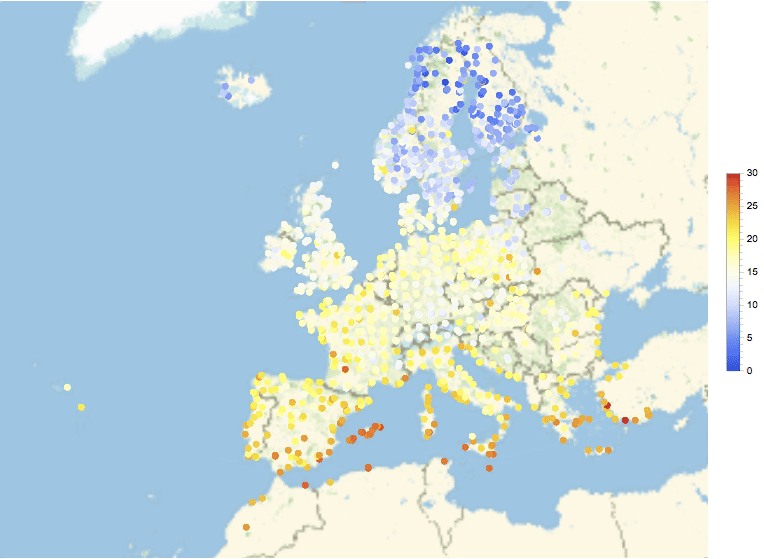
The second representation is calculated using

GeoRegionValuePlot[GeoPosition[{#[[2]], #[[1]]}] -> #[[3]] & /@ tab, PlotRange -> {0, 30}, ColorFunction -> "TemperatureMap", ImageSize -> Full]

which looks like this
enter image description here

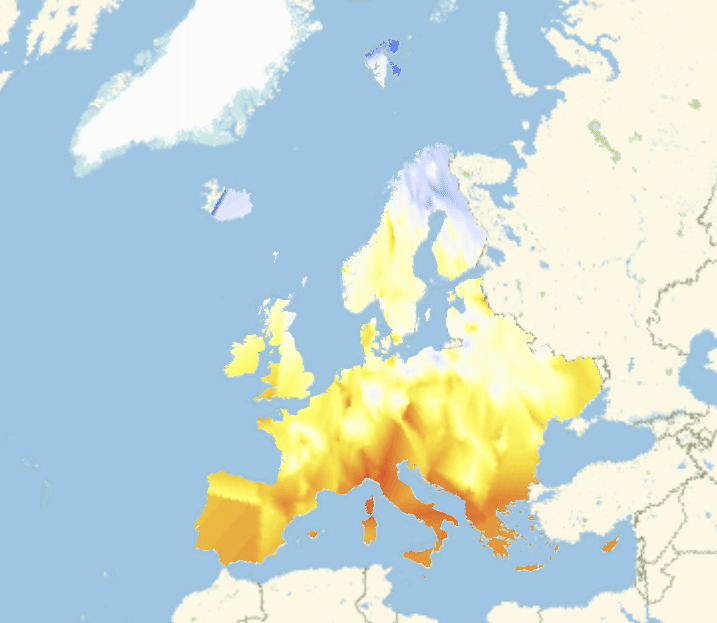
Finally, the lengthy sequence of commands

surface = Interpolation[{{#[[1]], #[[2]]}, #[[3]]} & /@ tab, InterpolationOrder -> 1];
cPlot = Quiet[ContourPlot[surface[x, y], {x, Min[tab[[All, 1]]], Max[tab[[All, 1]]]}, {y, Min[tab[[All, 2]]], Max[tab[[All, 2]]]}, ImagePadding -> None, 
ClippingStyle -> None, Frame -> None, Contours -> 60, ContourLines -> False, PlotRange -> {0, 30}, ColorFunction -> "TemperatureMap"]];
multipoly = Polygon[GeoPosition[Join @@ (EntityValue[EntityClass["Country", "Europe"], "Polygon"] /. Polygon[GeoPosition[x_]] :> x)]];
GeoGraphics[{GeoStyling[{"GeoImage", cPlot}], multipoly, Black, Opacity[1]}, ImageSize -> Full]

gives this representation
enter image description here

I am quite sure that with some modifications one can make a useful program out of this if one uses cloud deploy. Also, netatmo's data are updated every 30 minutes (every 5 minutes on the individual devices), so one can run a scheduled task and look at the development of the temperature. The large number of netatmo weather stations complements the data available from the Wolfram Data servers very nicely as they provide very up to date street level data.

I would be glad to see a good idea of a cloud deployed service based on this or any other ideas that you might have.

Cheers,

Marco

POSTED BY: Marco Thiel
9 Replies

Great example! How would the initial setup with credentials look if you used the new functions in 11? That is HTTPRequest and URLRead? I want to read the data from a cloud process and I am getting stuck with how to set up this part only using Wolfram

POSTED BY: Fredrik Doberl
Posted 8 years ago

Is that grant _type rather than granttype? curl -X POST -d "granttype=password&clientid=AAAAAAAAAAAAAAAAAAAA&clientsecret=BBBBBBBBBBBBBBBBBBBBBBBBBBBBBBBBBBBBBBBBBB &username=XXXXXXXXXXXXXXXX&password=YYYYYYYYYYYYYYY&scope=readstation" http://api.netatmo.net/oauth2/token ~/Desktop/request-token.txt

I'm getting invalid client responses, any thoughts as to what could be wrong ?

Thanks Ian

POSTED BY: Ian Neild

I think this would make a perfect data source for the Data Drop. I wish I could put my hands on this device. Relevant: Build Your Own Weather Station in a Snap with the Wolfram Cloud! Great post Marco!

POSTED BY: Sam Carrettie

enter image description here - another post of yours has been selected for the Staff Picks group, congratulations !

We are happy to see you at the tops of the "Featured Contributor" board. Thank you for your wonderful contributions, and please keep them coming!

POSTED BY: EDITORIAL BOARD

Apparently I missed this post, great work! Lots of data to play with!

POSTED BY: Sander Huisman

Dear Ian,

yes you are right. They changed the oauth protocol. You might want to try this:

This generates the key should you need one.

Run["~/Desktop/getNetatmokeyblog.sh > ~/Desktop/keys.txt"];
keysfile = Import["~/Desktop/keys.txt"];
accesstoken = StringSplit[StringSplit[keysfile, "\":\""][[2]], "\""][[1]];

Note that you need a terminal script. Here it is:

curl -X POST -d "grant_type=password&client_id=<clientidhere>&client_secret=<secrethere>&username=<usernamehere>&password=<passwordhere>scope=read_station" https://api.netatmo.com/oauth2/token

This needs to go into a script file - do not forget to substitute the respective parts including the "< >". I use OSX so it goes in an sh file and I need to make that executable. I changed to a script version, because I use this in public lectures and was not too happy to put my password and id directly on the slides. Of course you can execute that command "by hand" and use the accesstoken in the following. Here's how to get the data:

data = Import[
   "https://api.netatmo.com/api/getpublicdata?access_token=" <> 
    accesstoken <> 
    "&lat_ne=59.91&lon_ne=13.75&lat_sw=40.42&lon_sw=-20.0&filter=\
True", "Text"];
tab = Quiet[
   Select[Select[
     Table[ToExpression /@ 
       Flatten[StringSplit[#, "]"] & /@ StringSplit[#, "["] & /@ 
          If[Length[
             StringSplit[StringSplit[data, "place"][[k]], ","]] > 12, 
           Drop[StringSplit[StringSplit[data, "place"][[k]], 
             ","], {5}], 
           StringSplit[StringSplit[data, "place"][[k]], ","]]
         ][[{2, 3, 7, 8, 15}]], {k, 2, 
       Length[StringSplit[data, "place"]]}], 
     Length[Cases[Flatten[#], $Failed]] == 0 &  ], Length[#] == 5 &]];

This is how to plot it.

scaled = Rescale[tab[[All, 3]]]; GeoGraphics[
 Table[{GeoStyling[Opacity[0.99], 
    RGBColor[scaled[[k]], 1 - scaled[[k]], 0]], 
   GeoDisk[{tab[[k, 2]], tab[[k, 1]]}, 
    Quantity[20, "Kilometers"] ]}, {k, 1, Length[tab]}], 
 GeoBackground -> "Satellite", ImageSize -> Large]

enter image description here

This should work with their new system.

Cheers,

Marco

POSTED BY: Marco Thiel

Dear Frederik,

yes, I can use the build in functionality to get the access key too. It's quite straight forward to sent a POST command. I will try to update this later.

Best wishes, Marco

POSTED BY: Marco Thiel
Posted 8 years ago

Thanks Marco, so I tried again, NB you need a & before that scope so

curl -X POST -d "granttype=password&clientid=<clientidhere>&clientsecret=<secrethere>&username=<usernamehere>&password=<passwordhere>&scope=readstation" https://api.netatmo.com/oauth2/token

but I get "invalid_grant"

my post is like curl -X POST -d "granttype=password&clientid=AAAAAA&clientsecret=BBBBBB&username=user+extra@ISP.com&password=XXXX&scope=readstation" https://api.netatmo.com/oauth2/token

could it be the + I use in my email address

POSTED BY: Ian Neild
Posted 4 years ago

Hi, have you by chance updated the data preparation aka formula behind tab....it seems they have completely reworked the results. I managed to get the data but I'm not able to use the date because the tab gives me an empty list. Thank you...nice work.

POSTED BY: Andreas Nold
Reply to this discussion
Community posts can be styled and formatted using the Markdown syntax.
Reply Preview
Attachments
Remove
or Discard

Group Abstract Group Abstract