Group Abstract Group Abstract

Message Boards Message Boards

0
|
119 Views
|
1 Reply
|
1 Total Like
View groups...
Share
Share this post:

How to draw the asymptotes of the tangent function as red dashed lines?

Posted 1 day ago
Plot[Tan@x, {x, -2 \[Pi], 2 \[Pi]}, ExclusionsStyle -> {Dashed, Red},
      Exclusions -> "Discontinuities"]

enter image description here

How to draw the asymptotes of the tangent function as red dashed lines?

POSTED BY: Jim Clinton
Posted 1 day ago

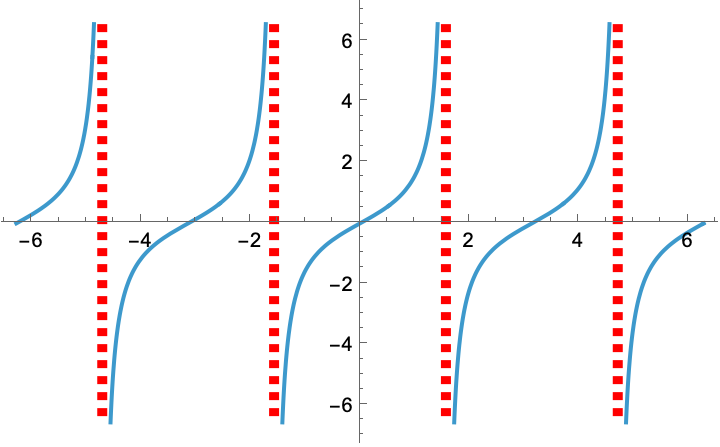
Maybe something like this:

Plot[Tan@x, {x, -2 Pi, 2 Pi}, ExclusionsStyle -> Directive[Dashed, AbsoluteThickness[5], Red]]

enter image description here

FWIW, the documentation for ExclusionsStyle spells this out.

POSTED BY: Eric Rimbey
Reply to this discussion
Community posts can be styled and formatted using the Markdown syntax.
Reply Preview
Attachments
Remove
or Discard