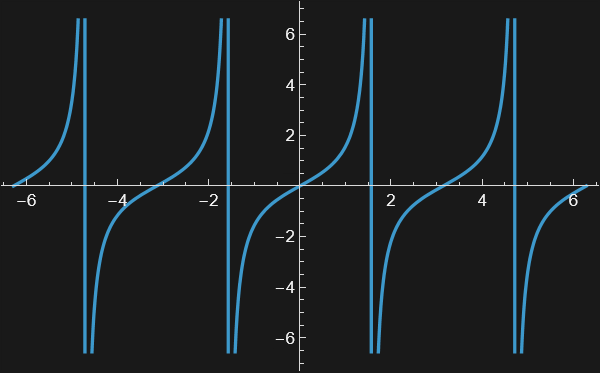
Plot[Tan@x, {x, -2 \[Pi], 2 \[Pi]}, ExclusionsStyle -> {Dashed, Red},
      Exclusions -> "Discontinuities"]
How to draw the asymptotes of the tangent function as red dashed lines?