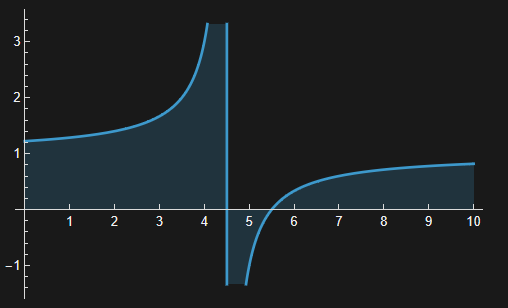
f[x_] := 1 - 1/(x - 9/2)
    Plot[f[x], {x, 0, 10}, Filling -> Axis,
     Ticks -> {Range[20], Automatic}, AxesOrigin -> {0, 0},
     ExclusionsStyle -> Directive[Dashed, AbsoluteThickness[0.5], Red],
     Exclusions -> "Discontinuities"]
In the above code, why is this segment of code unable to change the style and color of the automatically generated asymptotes? How can we set and modify the style and color of the asymptotes?
ExclusionsStyle -> Directive[Dashed, AbsoluteThickness[0.5], Red]
