Group Abstract Group Abstract

Message Boards Message Boards

0
|
40 Views
|
4 Replies
|
1 Total Like
View groups...
Share
Share this post:

How to change the form and color of the asymptote?

Posted 1 day ago
f[x_] := 1 - 1/(x - 9/2)  
    Plot[f[x], {x, 0, 10}, Filling -> Axis, 
     Ticks -> {Range[20], Automatic}, AxesOrigin -> {0, 0}, 
     ExclusionsStyle -> Directive[Dashed, AbsoluteThickness[0.5], Red], 
     Exclusions -> "Discontinuities"]

In the above code, why is this segment of code unable to change the style and color of the automatically generated asymptotes? How can we set and modify the style and color of the asymptotes?

ExclusionsStyle -> Directive[Dashed, AbsoluteThickness[0.5], Red]
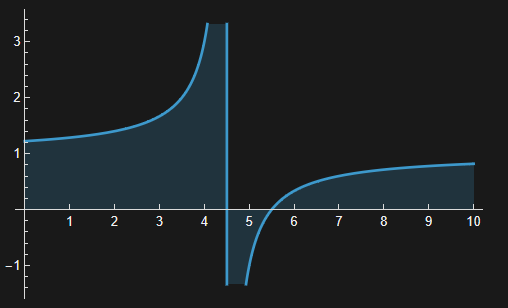
enter image description here

POSTED BY: Wen Dao
4 Replies
Posted 11 hours ago

The asymptote is not displayed in red.

POSTED BY: Wen Dao
Posted 11 hours ago

If you want both the effect of filling and the ability to freely change the style and color of the automatically generated function asymptote, how should the code be set?

POSTED BY: Wen Dao

An explicit Exclusions value changes the appearance of the asymptote:

f[x_] := 1 - 1/(x - 9/2);
Plot[f[x], {x, 0, 10}, Filling -> Axis, 
 Ticks -> {Range[20], Automatic}, AxesOrigin -> {0, 0}, 
 ExclusionsStyle -> Directive[Dashed, AbsoluteThickness[0.5], Red], 
 Exclusions -> 9/2]

Anyway, in this case I would recommend Exclusions -> "Singularities" instead of "Discontinuities".

POSTED BY: Gianluca Gorni
Posted 16 hours ago

Unfortunately, I don't know how to produce what you want, but I can tell you that the problem is due to setting Filling. If you can do without Filling then you'll get your asymptote. If you need the filling, then you might need to create your own composite plot.

POSTED BY: Eric Rimbey
Reply to this discussion
Community posts can be styled and formatted using the Markdown syntax.
Reply Preview
Attachments
Remove
or Discard