Group Abstract Group Abstract

Message Boards Message Boards

0
|
45 Views
|
3 Replies
|
1 Total Like
View groups...
Share
Share this post:

Tooltips are not always shown in DateListPlot

Posted 1 day ago

Tooltips are very useful when analyzing time series, but DateListPlot does not show the Tooltips always. I tried PlotHighlighting and other options. When are the Tooltips shown and when are they not shown?

Attached notebook shows actual data with Tooltips and without Tooltips.
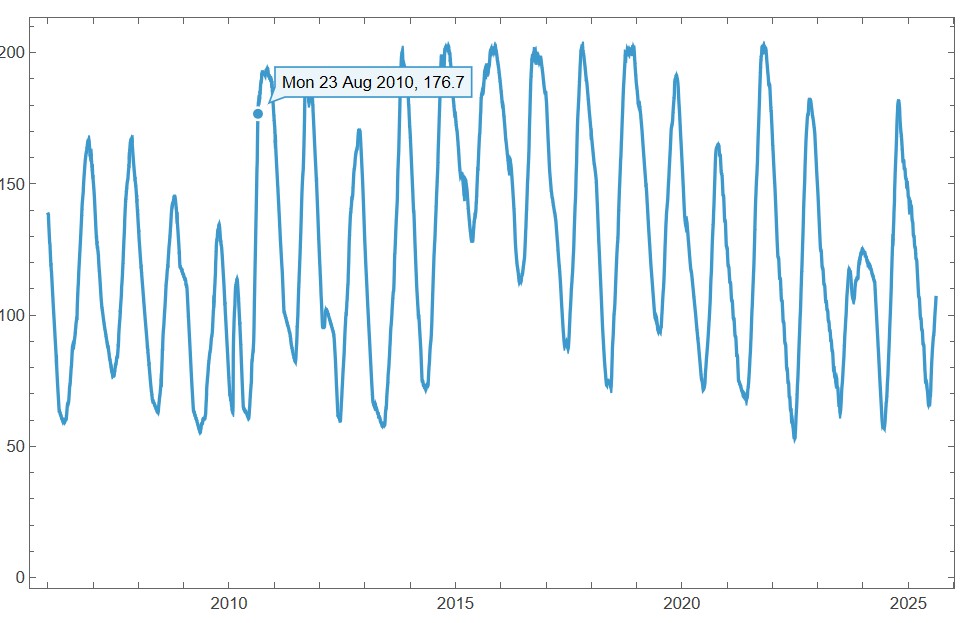
enter image description here

3 Replies

A workaround is to split the plot into smaller pieces:

Show[DateListPlot[dbo[[1 ;; 8000]]],
 DateListPlot[dbo[[8001 ;;]]],
 PlotRange -> All]
POSTED BY: Gianluca Gorni

I see! Thank you Gianluca.

Hmm, it seems that tooltips are displayed only for up to 10000 points, not one more:

DateListPlot[dbo[[1 ;; 10000]]]
DateListPlot[dbo[[1 ;; 10001]]]
POSTED BY: Gianluca Gorni
Reply to this discussion
Community posts can be styled and formatted using the Markdown syntax.
Reply Preview
Attachments
Remove
or Discard
