Message Boards Message Boards

1
|
3066 Views
|
7 Replies
|
1 Total Likes
View groups...
Share
Share this post:

Exclusion in plot problem

Posted 11 years ago

What is the problem with this code:

y = {-1, 0, 1}
Plot[x/y, {x, 1, 10}, Exclusions -> y == 0]

Why it is showing a division by zero problem

POSTED BY: Bilal Bilal
7 Replies
Posted 11 years ago

I want to plot the following 7 curves without their asymptotes:

\[Gamma] = {-0.99, -0.9, -0.5, 0, 0.5, 0.9, 0.99}

f[\[Lambda]_, \[Gamma]_] := (1 - 5 \[Lambda] + 4 \[Gamma]*\[Lambda]) (
  77 \[Lambda]^2 - 
   76 \[Gamma] \[Lambda]^2 + (10 \[Lambda] - 
      8 \[Gamma] \[Lambda]) (1 - 5 \[Lambda] + 
      4 \[Gamma] \[Lambda]))/(
  2 - (10 \[Lambda] - 8 \[Gamma] \[Lambda]) (2 - 5 \[Lambda] + 
      4 \[Gamma] \[Lambda]))

Plot[f[\[Lambda], \[Gamma]], {\[Lambda], 0, 1}, PlotRange -> {0, 20}, 
 Frame -> True]
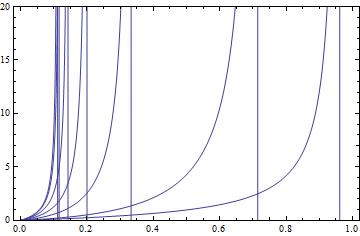
enter image description here

POSTED BY: Bilal Bilal

You could make 3 plots separately and then combine them using the function Show. I'm not sure what the exact problem is that you're looking at... which might complicate things...

POSTED BY: Sander Huisman
Posted 11 years ago

For every value of y, I have a different curve with an asymptote, so I must add an exclusion {B[x,-1]==0,B[x,0] == 0,B[x,1]==1} but the value of x in each exclusion will make a discontinuity on the other 2 curves also , then now I got rid of the asymptotes but as a result I will have 3 curves that each one of them contains two white spots inside of them. Do you agree ?

POSTED BY: Bilal Bilal

The main problem is that Exclusions -> vector==0 wil never happen! So try not to put y as a vector.

just plot

{A[x,-1]/B[x,-1],A[x,0]/B[x,0],A[x,1]/B[x,1]}

and then provide an exclusion like B[x,0] == 0

POSTED BY: Sander Huisman
Posted 11 years ago

What if I have something like this and I want to remove the asymptotes:

y = {-1,0,1}
Plot[A[x,y]/B[x,y],{x,0,1}]

Sould I use Exclusions->{B[x,y]!=0} or DeleteCases[B[x,y],0] or something else?

POSTED BY: Bilal Bilal
  1. The only variable in your plot-command is x, you can't do an exclude on the 'external' variable y.
  2. Exclusions -> {-1,0,1}==0 will not simplify.

Try:

y = {-1, 0, 1}
y= DeleteCases[y,0]
Plot[x/y, {x, 1, 10}]
POSTED BY: Sander Huisman
Posted 11 years ago

I believe it is because Plot first evaluates its argument.

POSTED BY: David Keith
Reply to this discussion
Community posts can be styled and formatted using the Markdown syntax.
Reply Preview
Attachments
Remove
or Discard

Group Abstract Group Abstract