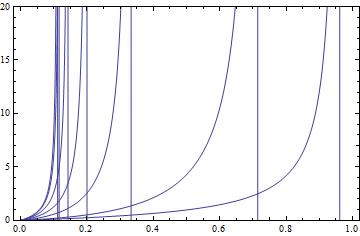
What is the problem with this code:
y = {-1, 0, 1} Plot[x/y, {x, 1, 10}, Exclusions -> y == 0]
Why it is showing a division by zero problem
You could make 3 plots separately and then combine them using the function Show. I'm not sure what the exact problem is that you're looking at... which might complicate things...
For every value of y, I have a different curve with an asymptote, so I must add an exclusion {B[x,-1]==0,B[x,0] == 0,B[x,1]==1} but the value of x in each exclusion will make a discontinuity on the other 2 curves also , then now I got rid of the asymptotes but as a result I will have 3 curves that each one of them contains two white spots inside of them. Do you agree ?
The main problem is that Exclusions -> vector==0 wil never happen! So try not to put y as a vector.
just plot
{A[x,-1]/B[x,-1],A[x,0]/B[x,0],A[x,1]/B[x,1]}
and then provide an exclusion like B[x,0] == 0
What if I have something like this and I want to remove the asymptotes:
y = {-1,0,1} Plot[A[x,y]/B[x,y],{x,0,1}]
Sould I use Exclusions->{B[x,y]!=0} or DeleteCases[B[x,y],0] or something else?
Try:
y = {-1, 0, 1} y= DeleteCases[y,0] Plot[x/y, {x, 1, 10}]
I believe it is because Plot first evaluates its argument.