Message Boards Message Boards

Detecting patterns in the Time Series

Posted 10 years ago

Pattern analysis in the time series is useful approach for data decomposition and detection of drivers that affect trends, dispersion or curvature. Combination of standard time series techniques with statistical analysis, probability and signal processing methods provide powerful base for quick pattern detection. Mathematica 10 brings extended functionality in every dimension which makes the pattern analysis quick and efficient task.

TS with quarterly trend

Attachments:
POSTED BY: Igor Hlivka
13 Replies
Posted 10 years ago

Thanks for your quick response Igor! Will try out your instructions. Any idea how to implement a Bayesian Regression Algorithm on historical prices of Bitcoins (BTC/USD); say from January 11, 2011 to March 20, 2015 and backtest it? Here's the link to the pdf file describing the algorithm: http://arxiv.org/pdf/1410.1231.pdf A bit of sample code to start on my own will help. I am really a novice when it comes to Mathematica.

POSTED BY: Aryan Howl
Posted 10 years ago

How do we detect patterns in BTC/USD (Bitcoin/US Dollar) and BTC/LTC (Bitcoin/Litecoin) prices/trading volumes by hooking into Bloomberg Link and cryptocoincharts API?

POSTED BY: Aryan Howl

Hello Aryan BTCUSD and BTCLTC are fundamentally the same as any other currency pairs time series and the patterns detection techniques which I showed in the document will equally apply to BTC / LTC . This assumes that historical data is available.

Get the historical data using Bloomberg Link and convert them into Time series with appropriate data stamps. Resample the data to create continuous series and apply any method you like to detect (I) trend, (ii) volatility and higher-order moments.

Hope this answers your question. If you, feel free to come back.

Kind regards Igor

POSTED BY: Igor Hlivka

Hi Igor, thanks a lot for the explanation. I'm just frustrated that the FinancialData command is not consistent. For example this will work:

FinancialData["USD/JPY"]

but this will not:

FinancialData["USD/JPY", {{2009, 1, 1}, {2014, 11, 07}}]

The correct way is what you did:

FinancialData["JPY=X", {{2009, 1, 1}, {2014, 11, 07}}]

But this last command template is documented nowhere as far as I know :-(

Regards, Ruben

Ruben

This is exactly what I explained yesterday. Yahoo maintains two sets of tickers - (I) live spot and (ii) historical indices.

Spot can be entered as "USDGBP", however if you need the historical series, you need to enter "GBP=X".

You're right. This duality feature is not documented (yet). Treat this explanation as "User - Explored Documentation".

Hope this helps Igor

POSTED BY: Igor Hlivka

Igor, thanks a lot for the file! The main problem with my approach was that the structure of the data was not in the time series format. I just used Import. However, I'm mystified by the use of "JPY=X" in the FinancialData command in Mathematica. Is this use documented somewhere? By the way, I think your materials are excellent for showing Mathematica's capabilities in finance and risk management and I'm looking forward to reading more of them. Regards, Ruben

Ruben

Please find below the link for the Yahoo Finance that gives you the list of currencies they provide the historical data: https://uk.finance.yahoo.com/currencies/investing.html When you click on any currency pair, you will get the Yahoo ticker which is valid for historical series.

Please note that the Yahoo support different tickers for historical series and live sports. The logic "ABC=X" applies to any series for standard currency quote (against $US).

I am certainly delighted to hear that the stuff helps you getting the understanding of Mathematica in Finance (-:

Kind regards Igor

POSTED BY: Igor Hlivka

Hi Igor, I have tried to replicate your results related to the cumulants and the gaussian filter but I haven't been able to get the same results as you. All the previous calculations were ok. Here's my code and the resulting graphs:

cs = TimeSeriesAggregate[jpyhdata, "Quarter", Cumulant[#, 2] &];
SmoothHistogram[cs, PlotTheme -> "Business", PlotStyle -> Red, 
 Filling -> Axis, FillingStyle -> Yellow]
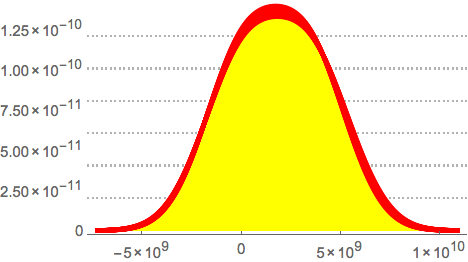
Smooth Histogram

DateListPlot[GaussianFilter[hvol, 4], PlotTheme -> "Web", 
 PlotStyle -> Blue, PlotLabel -> "Volatility with Gaussian Filter"]
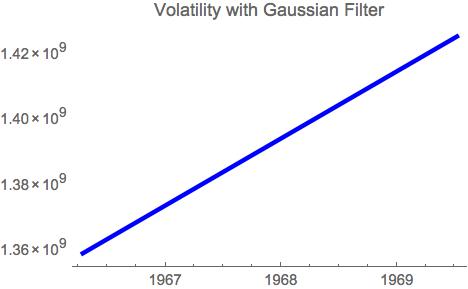
Gaussian Filter

May I know what I'm doing incorrectly? Many thanks in advance, Ruben

Hello Ruben

I have enclosed the Mathematica notebook that contains the code for the document. Hope this solves your query. Kind regards Igor

Attachments:
POSTED BY: Igor Hlivka

Hi Igor, may I know how to reproduce the residuals plot showing the different magnitude of dispersion? Many thanks in advance, Ruben

Hi Igor, thanks again for such a great post. As usual I'd like to replicate your results on my own and I've been able to get the data for the JPY/USD exchange rate from QUANDL (1/1/2009 - 11/30/2014) and save them in the variable named "jpyhdata" but I'm wondering about the contents of the variable "win" that you use in the TimeSeriesAggregate commands. May I know what information it contains? How can I create it? Many thanks in advance, Ruben

Hello Ruben

I do apologise for the late reply. The "win" term in the code refers to the window period = Quarter. All functions therefore use the quarter as the aggregation period. Hope this answers your question. Kind regards Igor

POSTED BY: Igor Hlivka

Hi Igor, thanks a lot! Regards, Ruben

Reply to this discussion
Community posts can be styled and formatted using the Markdown syntax.
Reply Preview
Attachments
Remove
or Discard

Group Abstract Group Abstract