Hi Igor,
I have tried to replicate your results related to the cumulants and the gaussian filter but I haven't been able to get the same results as you. All the previous calculations were ok.
Here's my code and the resulting graphs:
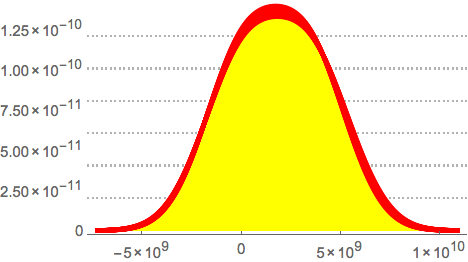
cs = TimeSeriesAggregate[jpyhdata, "Quarter", Cumulant[#, 2] &];
SmoothHistogram[cs, PlotTheme -> "Business", PlotStyle -> Red,
 Filling -> Axis, FillingStyle -> Yellow]

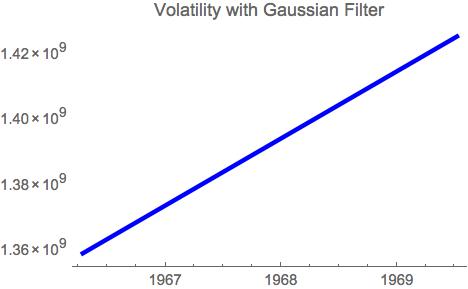
DateListPlot[GaussianFilter[hvol, 4], PlotTheme -> "Web",
 PlotStyle -> Blue, PlotLabel -> "Volatility with Gaussian Filter"]

May I know what I'm doing incorrectly?
Many thanks in advance,
Ruben