You can modify your url to change the format to CSV for downloading:
url = "https://docs.google.com/spreadsheets/d/1BvqdIUxuMVS2kNsg4tl53iVpNyj1tnYnO3zXH5qW9Rk/export?format=csv";
Then you can import it (I needed to use the CharacterEncoding option to get the characters to import normally):
csv = Import[url, "CSV", CharacterEncoding -> "UTF8"];
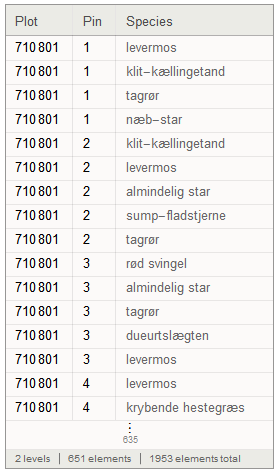
Then you can make a Dataset, which makes data a little bit easier to reason with in many cases:
dataset = Dataset[Map[AssociationThread[First[csv], #] &, Rest[csv]]]

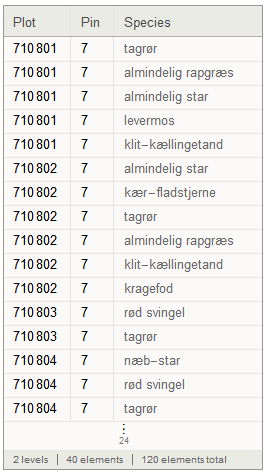
Now you can get all the species with pin equal to 7, for example:
dataset[Select[#Pin == 7 &]]

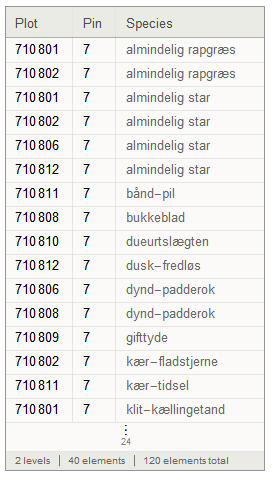
Or do the same and then sort by species, alphabetically:
dataset[Select[#Pin == 7 &] /* SortBy[#Species &]]

Or group by species, get a count of how many there are for each species (using Length) and sorting that in descending order:
dataset[GroupBy[#Species &] /* Sort /* Reverse, Length]

Or group by station and then by species (the extra //Normal // Dataset should not be needed, but helps with formatting):
ds2 = dataset[GroupBy[#Plot &], GroupBy[#Species &] /* Sort /* Reverse, Length] // Normal // Dataset

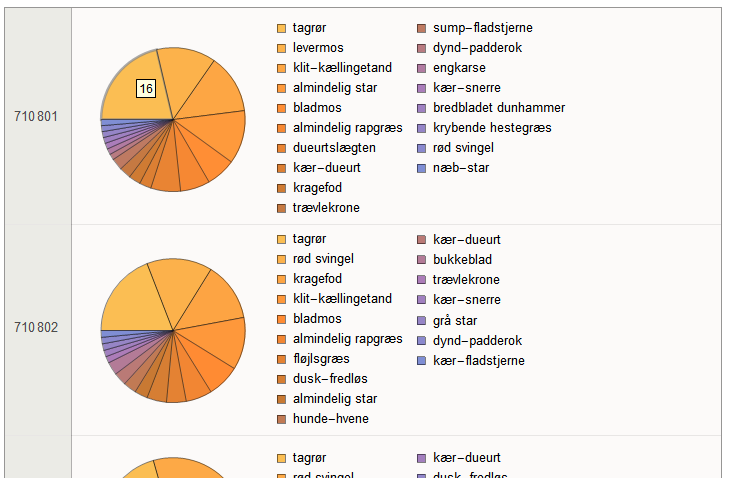
Or, proceeding with data set 'ds2', make pie charts for each distribution:
ds2[All, PieChart[#, ChartLegends -> Keys[#]] &]
