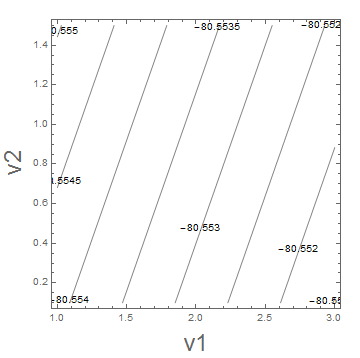
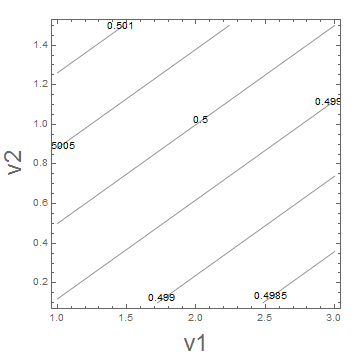
The code from Bill Simpson works fine for me (Windows 7, Mathematica 10.0) (i.e., no errors with the same results). Contour plots of the resulting equations in the rectangular area for v1 (1 to 3) and v2 (0.1 to 1.5) does not give any values near zero.
ContourPlot[(1 + vol1) Exp[vol1] - (fw*qs1ts + qs1te*Exp[vol2])/
   f01 - .5 vol2 Exp[vol1], {v1, 1, 3}, {v2, .1, 1.5},
 ContourLabels -> All, ContourShading -> None, Frame -> True,
 FrameLabel -> {{Style["v2", Large], ""}, {Style["v1", Large], ""}}]
ContourPlot[(1 + vol2) Exp[vol2] - (fw*qs12ts + qs1te*Exp[vol1])/f02 -
   qs1te/qs2te .5 vol1*Exp[vol2], {v1, 1, 3}, {v2, .1, 1.5},
 ContourLabels -> All, ContourShading -> None, Frame -> True,
 FrameLabel -> {{Style["v2", Large], ""}, {Style["v1", Large], ""}}]


So it would seem there are 4 somewhat overlapping possbilities: (1) there is some different in Bill's translation, (2) the original code is not exactly what is desired, (3) the thought that v1 and v2 should be in the stated ranges is wrong, and (4) the code is correct and the results for v1 and v2 are correct. Do you have other possibilities that you'll be checking out?